About the Project
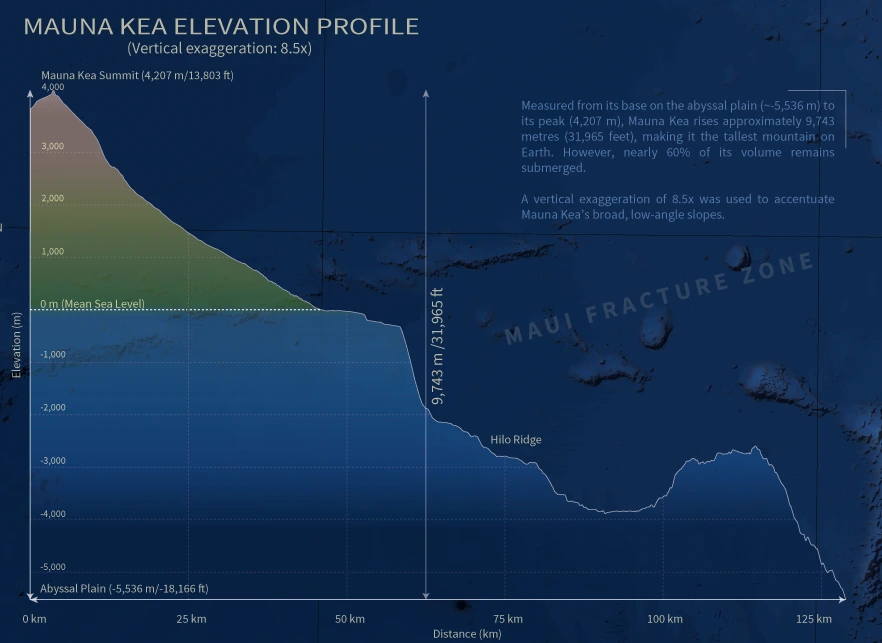
The primary objective of Hawaiʻi: Seafloor to Summit was to design a 48” × 36” large-format topo-bathymetric map that accurately conveys the true vertical scale of the eight main Hawaiian Islands, from the abyssal seafloor to the summit of Mauna Kea, emphasizing that when measured from its submarine base, Mauna Kea is considered the tallest mountain in the world.
Typically, map elevations are measured as the vertical distance above or below a reference datum, most commonly mean sea level. However, conventional topographic maps often visually understate submarine topography and, much like an iceberg, fail to communicate the full relief of geologic formations that extend below the ocean surface. As a result, they do not adequately convey the full vertical scale of the Hawaiian Islands.
The topobathymetric surface used in this map was derived from a mosaic of multiple DEM sources, including the NOAA NCEI Coastal Relief Model (CRM) (~30 m) and ETOPO2022 (~450 m), as well as multibeam bathymetry from SOEST’s Hawaiʻi Mapping Research Group (~50 m). The CRM provides nearshore coverage, ETOPO2022 provides global bathymetry, and the multibeam data contribute higher-resolution detail where available. Due to differences in spatial resolution and coverage, all datasets were resampled to a common 90 m grid to balance detail, continuity, and visual consistency across the surface. Source datasets reference differing vertical datums, resulting in minor elevation offsets; however, these differences are negligible at the 90 m resolution used in this map and do not affect overall terrain representation.
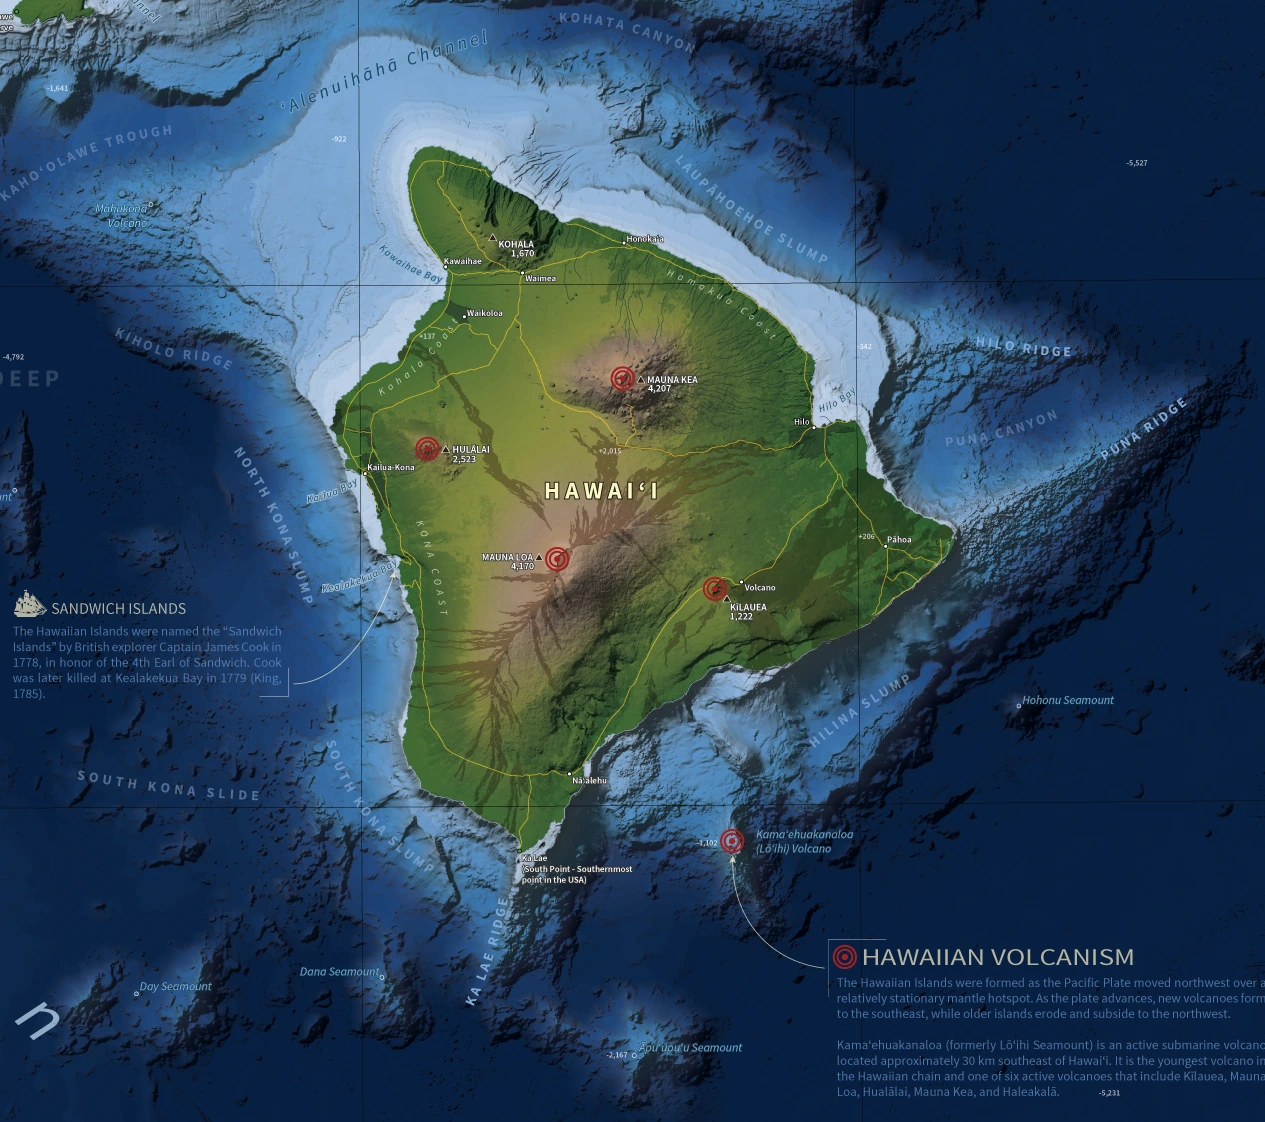
A key design consideration was the symbolization of the merged DEM using a custom, continuous, diverging colour ramp that seamlessly blended topography and bathymetry at mean sea level. This involved extensive experimentation with colour stops, positioning, transparencies, and manual classification intervals. Hillshading and slope highlights were applied to accentuate geomorphology and improve terrain interpretation, particularly below the ocean surface.
Bathymetric and terrestrial features were identified and labelled, including points of interest, population centres, summits, volcanoes, seamounts, and underwater landslides. Subtle typographic hierarchy and placement were also used as visual depth cues to accentuate the pseudo-3D terrain effect.
The map also includes several small contextual snippets highlighting major features and important historical events, an 8.5× vertically exaggerated elevation profile of Mauna Kea to reinforce the seafloor-to-summit narrative, and an inset map of the Hawaiian Archipelago for location context.
Technology Stack
- ArcGIS Pro
- Adobe Illustrator
Applied Skills
- Applied raster processing techniques to resample and merge multiple DEM datasets into a continuous topobathymetric surface.
- Designed and implemented a custom diverging colour ramp to effectively communicate elevation change across terrestrial and bathymetric environments.
- Applied cartographic design principles to develop a clear and visually balanced map layout supporting the seafloor-to-summit narrative.
- Produced a topobathymetric map that communicates complex elevation relationships through effective visualization and supporting contextual elements.
- Extracted elevation data from DEMs and designed a vertically exaggerated elevation profile of Mauna Kea to effectively communicate its full seafloor-to-summit extent.