About the Project
The purpose of this assignment was to develop an engaging cartographic animation in ArcGIS Pro that effectively visualizes spatial–temporal change within a dataset of our choosing. To achieve this, NYC yellow taxi trip record data from January 2026 was selected for analysis, enabling the exploration of transportation demand over time across New York City.
The animation was designed to highlight spatial trends in taxi activity using a one-hour sampling interval over a 24-hour period between Dec 31, 2025 (11 PM) and Jan 2, 2026 (12 AM). Taxi pickup data was queried, summarized, and joined to taxi zone polygons to calculate pickup counts per zone per hour. These values were then symbolized using graduated colours with a nine-class colour ramp (to accentuate change), with NYC borough polygons included to provide locational context.
Findings
Once the visualization was completed, several trends became immediately clear. Between 11:00 PM and 12:00 AM on December 31, a taxi zone in Manhattan is not rendered at all and is therefore not selectable, despite being surrounded by zones with high pickup volumes. While this may reflect zero recorded pickup activity or a limitation in how zero values are symbolized, the spatial and temporal context strongly suggests an association with New Year’s Eve celebrations in Times Square and the Theatre District, where vehicular access is heavily restricted. By 1:00 AM, the zone reappears—becoming both visible and selectable—with recorded pickup activity, suggesting that restrictions have eased and normal taxi service has resumed as crowds disperse.
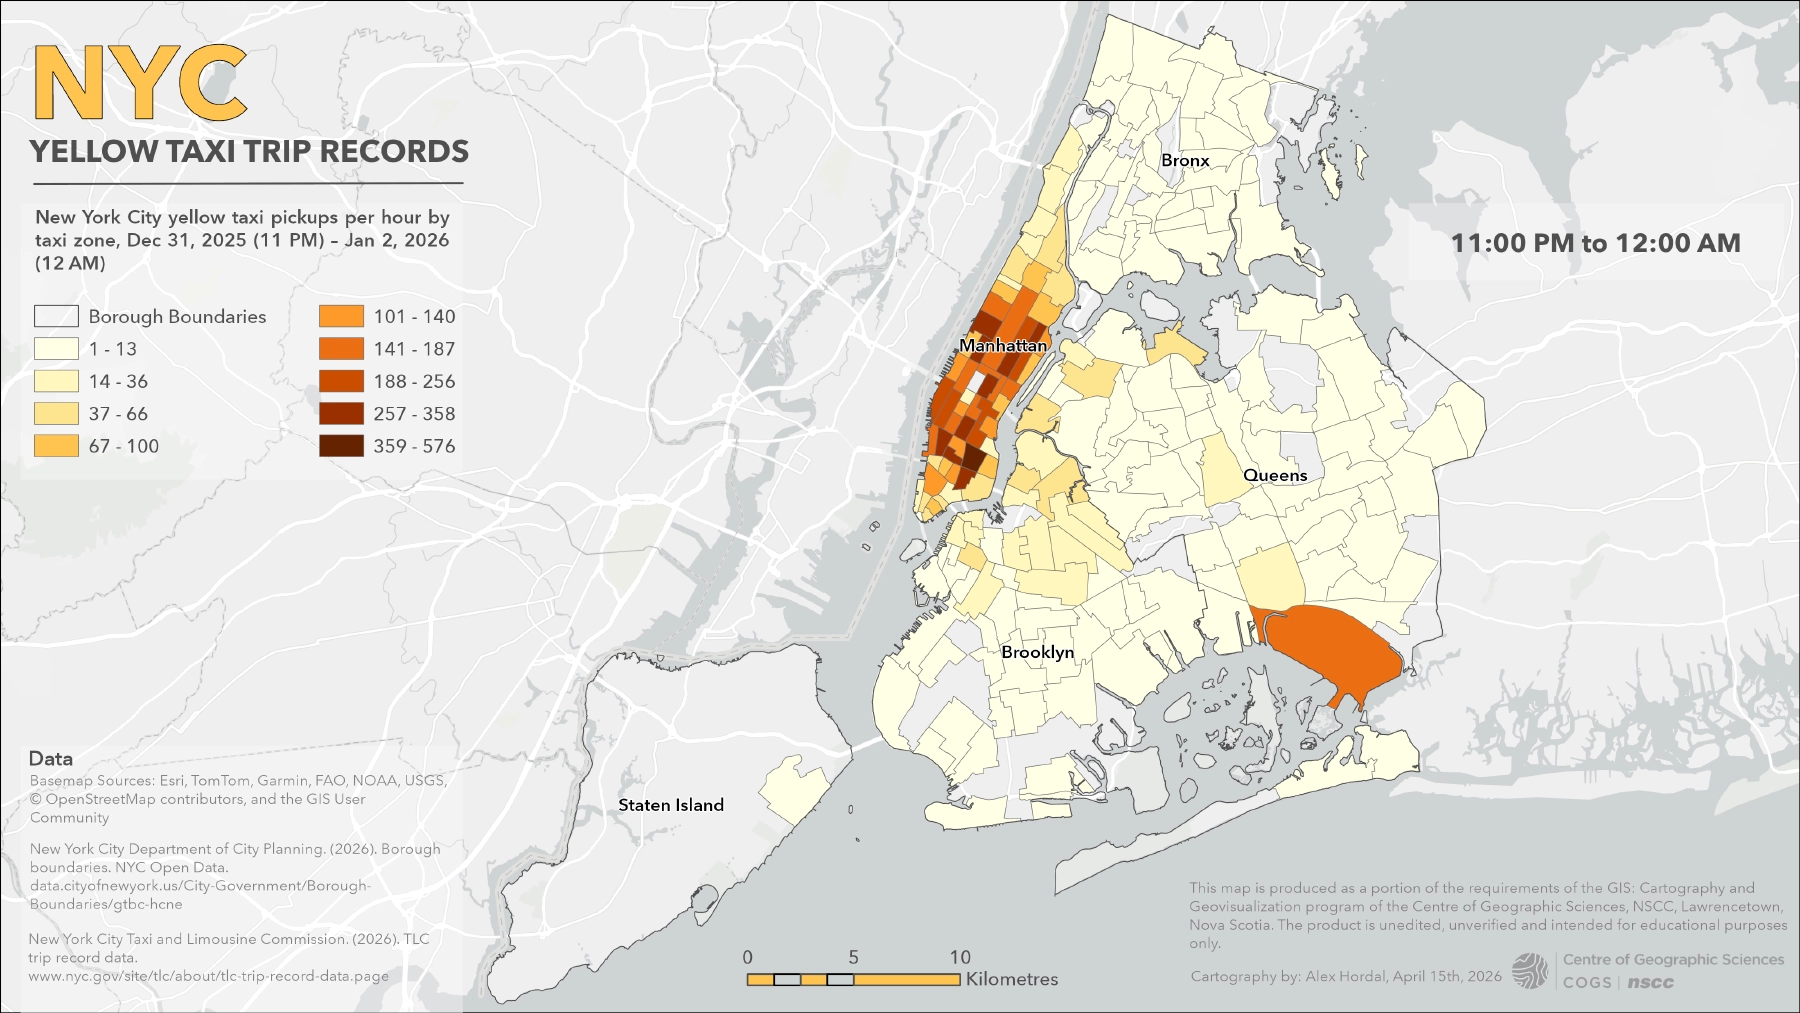
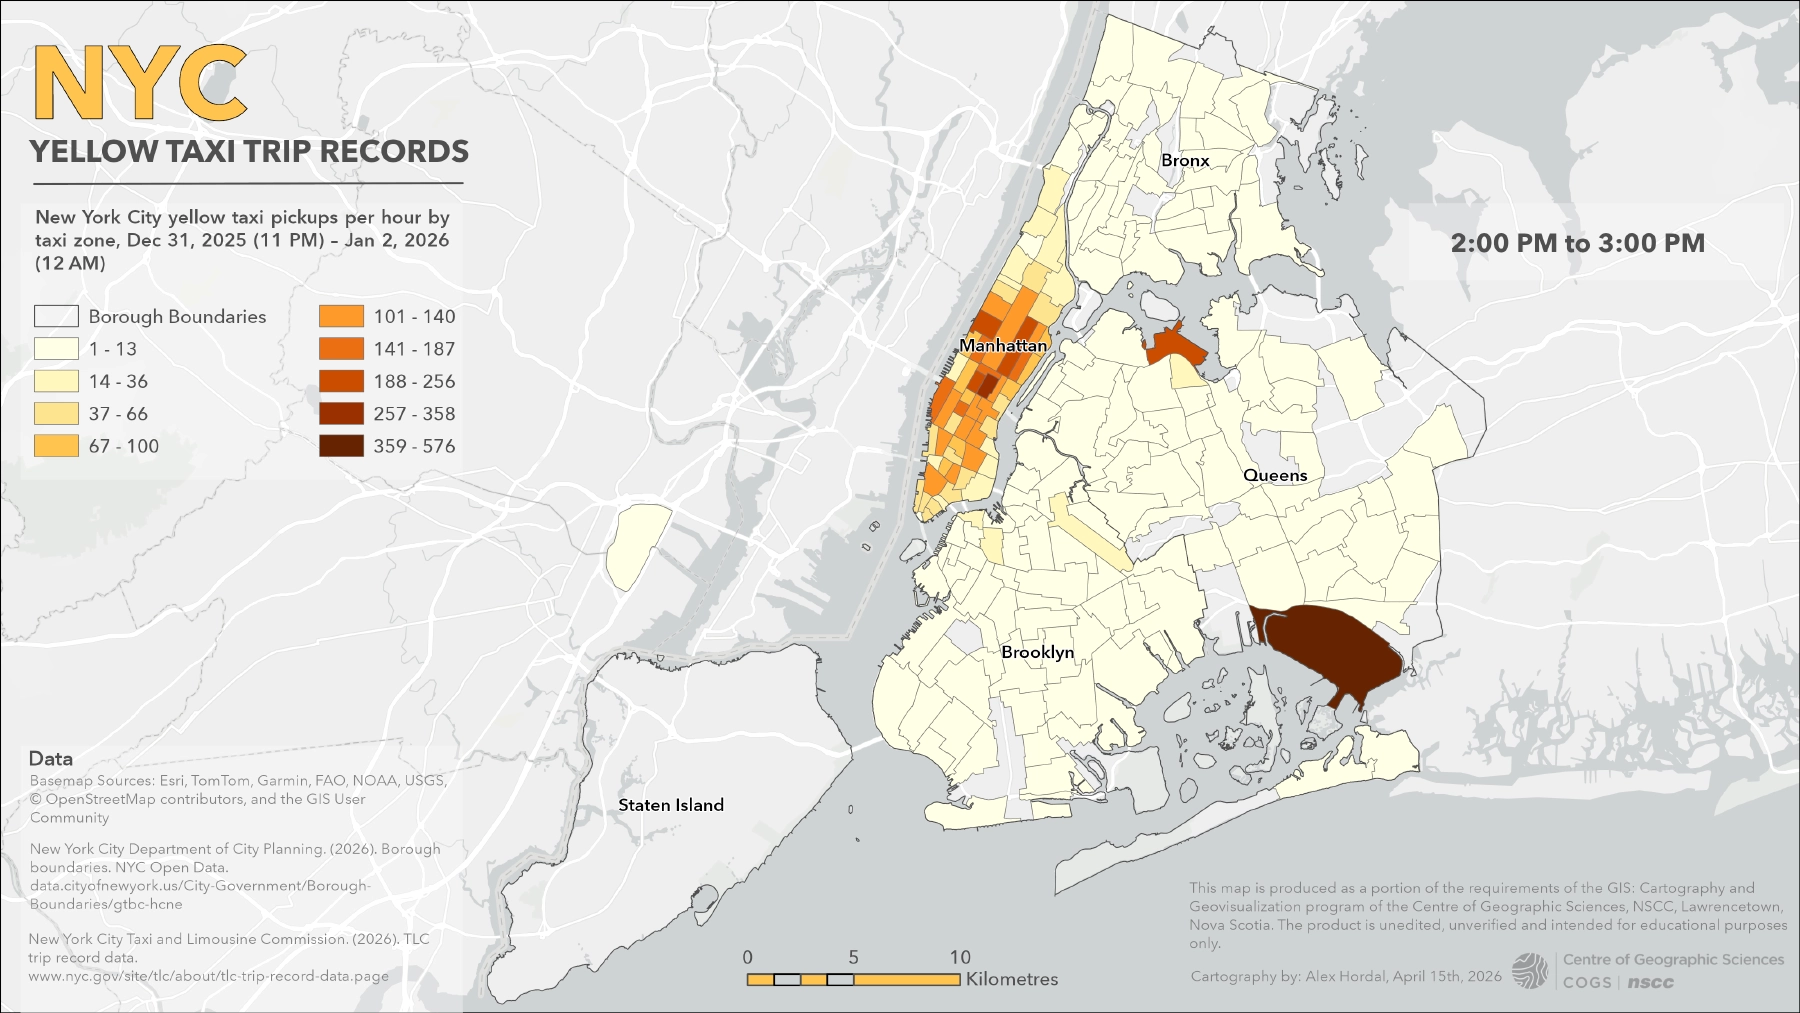
Two taxi zones with consistently high pickup densities are visible at the northern and southern ends of Queens. These correspond to New York City’s two major airports: LaGuardia Airport (LGA) to the north, which primarily serves domestic routes, and John F. Kennedy International Airport (JFK) to the south, which serves a larger volume of international traffic.
Both airports show a noticeable decrease in pickups between 12:00 AM and 4:00 AM on January 1, coinciding with a typical overnight lull in flight operations. Pickup activity at JFK begins to increase around 5:00 AM, aligning with the start of early morning international departures. In contrast, LaGuardia remains relatively quiet until approximately 8:00 AM, when pickup volumes begin to rise.
Both airports experience their highest pickup densities beginning around 1:00 PM, remaining consistently busy through the evening until approximately 10:00 PM. The higher pickup volumes observed at JFK relative to LaGuardia likely reflect differences in airport size, capacity, and the range of destinations served.
Generally, pickup densities in Staten Island remain consistently low or negligible throughout the period. In contrast, taxi zones in Brooklyn, Queens, and the Bronx that are in close proximity to Manhattan remain relatively active during the first few hours after midnight on New Year’s Eve, before gradually decreasing as the morning progresses. This likely reflects late-night activity and the dispersal of revellers returning home.
Manhattan experiences the highest overall volume of yellow taxi pickups, which is expected given its role as the primary service area for yellow taxis. However, it still exhibits a noticeable lull in activity between approximately 4:00 AM and 8:00 AM.
Technology Stack
- ArcGIS Pro
- Microsoft Clipchamp
Applied Skills
- Integrated multiple geospatial datasets by joining non-spatial taxi trip records to polygon features for spatial analysis.
- Structured and aggregated temporal data to generate hourly summary statistics for time-enabled visualization.
- Designed and applied graduated colour symbology to communicate spatial patterns in taxi pickup activity.
- Implemented time-enabled layers and keyframe animation workflows in ArcGIS Pro.
- Designed and exported a well-paced spatial–temporal animation while maintaining visual clarity and viewer engagement.