About the Project
This terrain series comprises seven terrain visualization labs exploring advanced techniques in terrain representation. The project includes Contours, Spot Heights & Hypsometric Tints; False Colour Image Enhancement; Composite Hillshades; Swiss-Style Shaded Relief (à la Imhof); Blender-Based 3D Terrain Modelling; Artistic Relief Methods; and LiDAR for Large-Scale Relief Visualization.
All terrain labs initially began in ArcGIS Pro, where elevation datasets such as DEM and LiDAR surfaces were processed and prepared for visualization. From there, the workflow varied depending on the cartographic objective, with outputs completed across ArcGIS Pro, Blender, Adobe Photoshop, and Adobe Illustrator.
The project focused on exploring different approaches to terrain representation while reinforcing workflows involving hillshading, contour generation, colour application, terrain modelling, and relief composition. Several labs emphasized the relationship between lighting, elevation structure, and cartographic readability in both 2D and 3D terrain environments.
DEM-derived products including contours, hillshades, and hypsometric tints were generated within ArcGIS Pro to accurately represent terrain structure and elevation variation. Additional workflows incorporated controlled lighting techniques, custom colour ramps, LiDAR point reclassification, and terrain masking to refine visual hierarchy and terrain readability.
Several terrain studies also incorporated Blender-based workflows, where DEM data was imported to construct 3D terrain surfaces and generate custom hillshading through controlled camera positioning and lighting environments. The resulting visualizations combined analytical accuracy with cartographic design considerations to create layered and visually cohesive terrain representations.
These terrain studies were later incorporated into the Terrain Atlas project
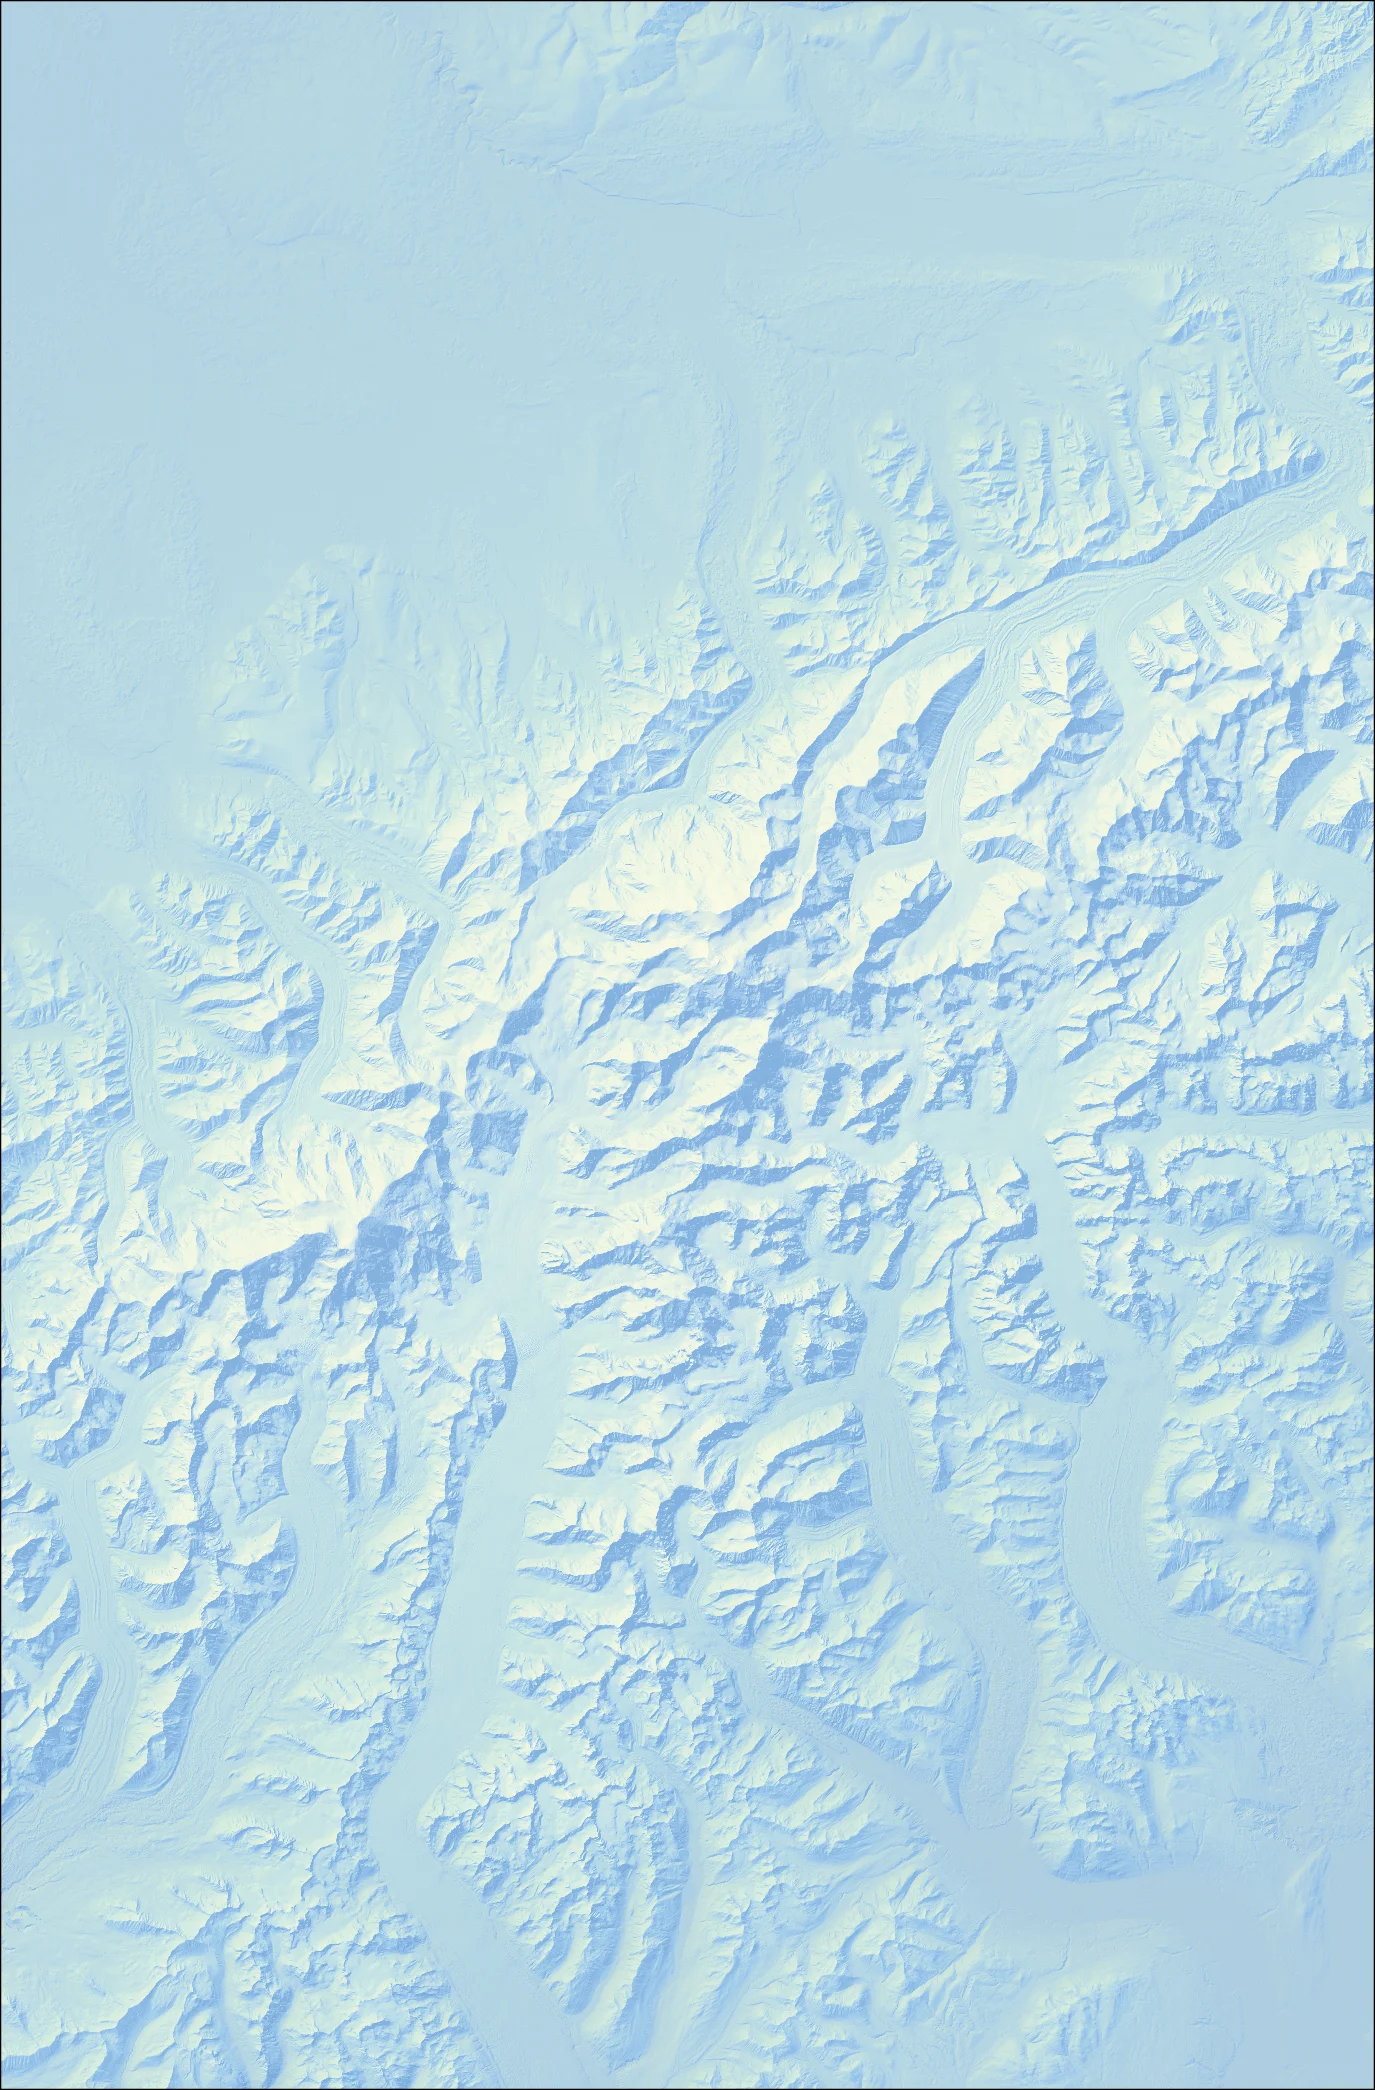
This relief depicts Denali (formerly Mount McKinley) in the Alaska Range, the tallest mountain in North America at 20,310 ft, and is inspired by the relief representation techniques of Swiss cartographer Eduard Imhof. Created in ArcGIS Pro, the process began by generating a hillshade from a USGS DEM using a standard azimuth of 315° and an altitude of 45°, representing oblique lighting from the northwest. Additional hillshades were generated using raster calculations to simulate an aerial perspective, with higher elevations appearing lighter and lower elevations appearing darker. To further refine the relief, focal statistics were applied to a third and final hillshade to generalize and soften terrain features. Then, values from the three hillshades (aerial, focal, and original) were reassigned using the Slice Tool and recombined using the Raster Calculator into a final composite relief. Colours and layer transparency were adjusted to produce the characteristic blue-yellow tones characteristic of Imhof-style relief (International Cartographic Association, n.d.). The final relief is an aerial, birds-eye view of Denali that enhances 3D perception while maintaining clarity.
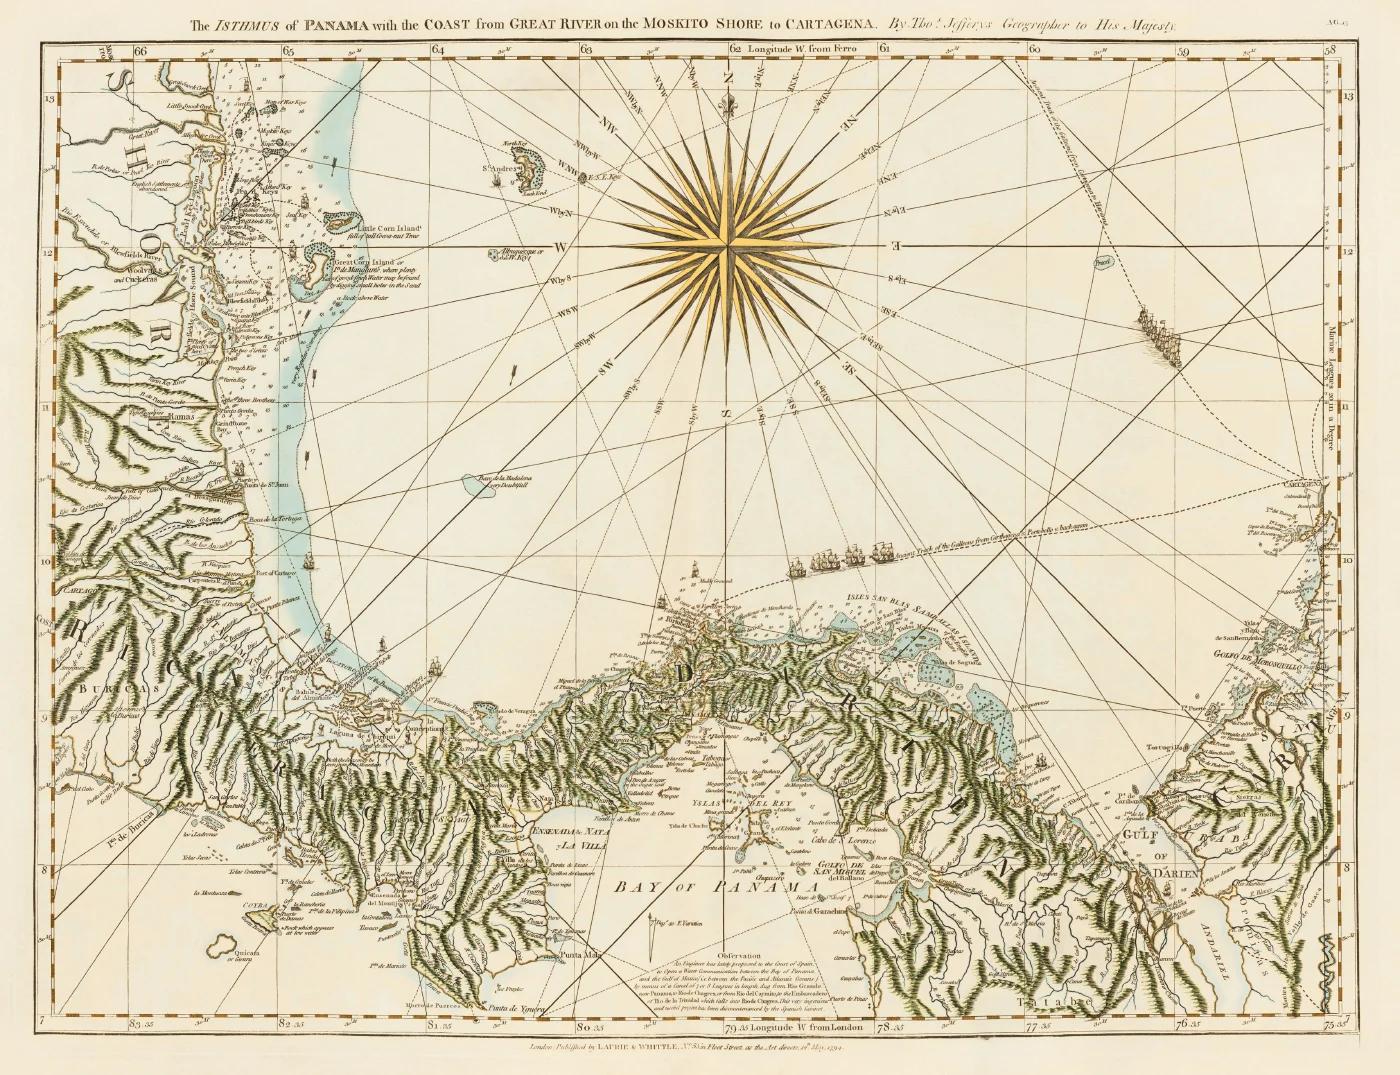
This relief depicts a false-colour representation of cartographer Thomas Jefferys’ nautical chart The Isthmus of Panama with the coast from Great River [current-day Río Chagres or Chagres River] on the Mosquito Shore (Nicaragua and Honduras) to Cartagena, Colombia (David Rumsey Map Collection, n.d.). The chart was imported into Adobe Photoshop, where it was appropriately trimmed to size, and various colouring techniques were applied using different brush sizes, opacity settings, and blending modes. Selections were used to control the colouring of more precise features, including the compass rose and the map’s neatline, and were saved within the document so they could be adjusted quickly as needed. Colour was applied selectively to provide contextual information. Light blue with low opacity was used to indicate reefs and shallow water, dark green to emphasize mountainous terrain, darker blue for rivers, and light brown to represent the coastline. This approach preserved the character of the historical chart while enhancing geographic features.
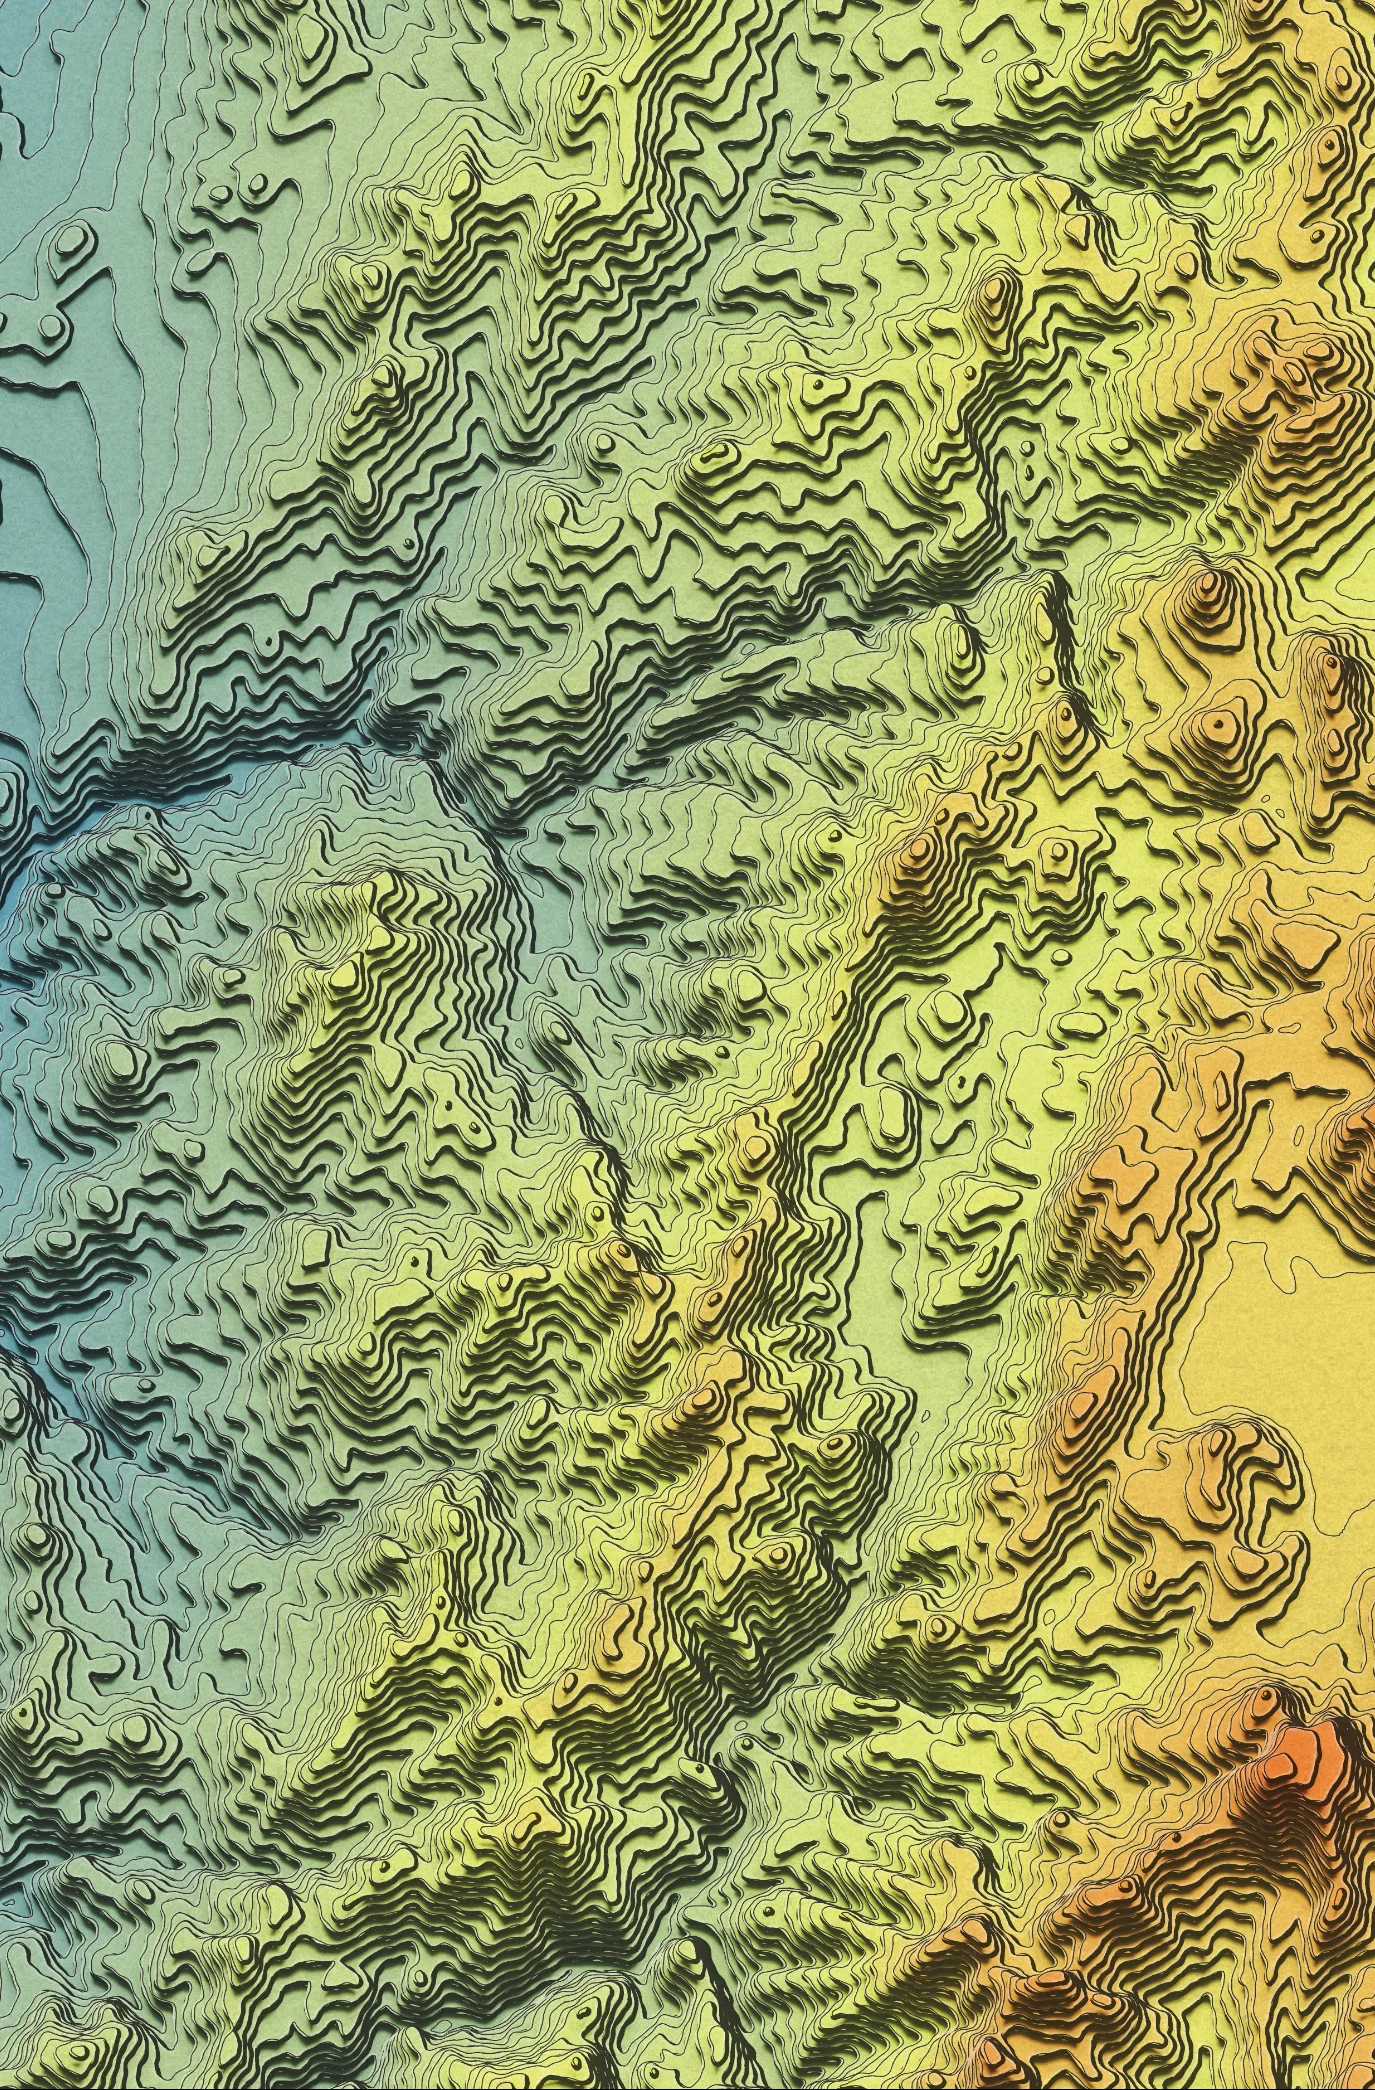
This relief depicts an artistic representation of part of the Puna de Atacama plateau in northwestern Argentina, a high elevation volcanic plateau within the Central Andes. This workflow is adapted from John Nelson’s YouTube tutorial, Re creating Trippy AI-Generated Terrain Contours (Nelson, 2023). The first step was to acquire an SRTM DEM of the study area. The Focal Statistics tool in ArcGIS Pro was then used to blur and smooth the DEM, followed by an additional iteration to remove any artifacts introduced by the process. Once the DEM was smoothed, contours were generated at 100m intervals, using the contour shell up option, producing a set of stacked elevation polygons. The polygons were vertically offset to create an isometric effect, and a colour ramp was applied to symbolize elevation. Additional techniques were then used to add highlights and shadows to the polygons, and a poster paper texture was applied as an overlay. The final step involved adjusting layer blending and opacities to achieve the desired visual effect.
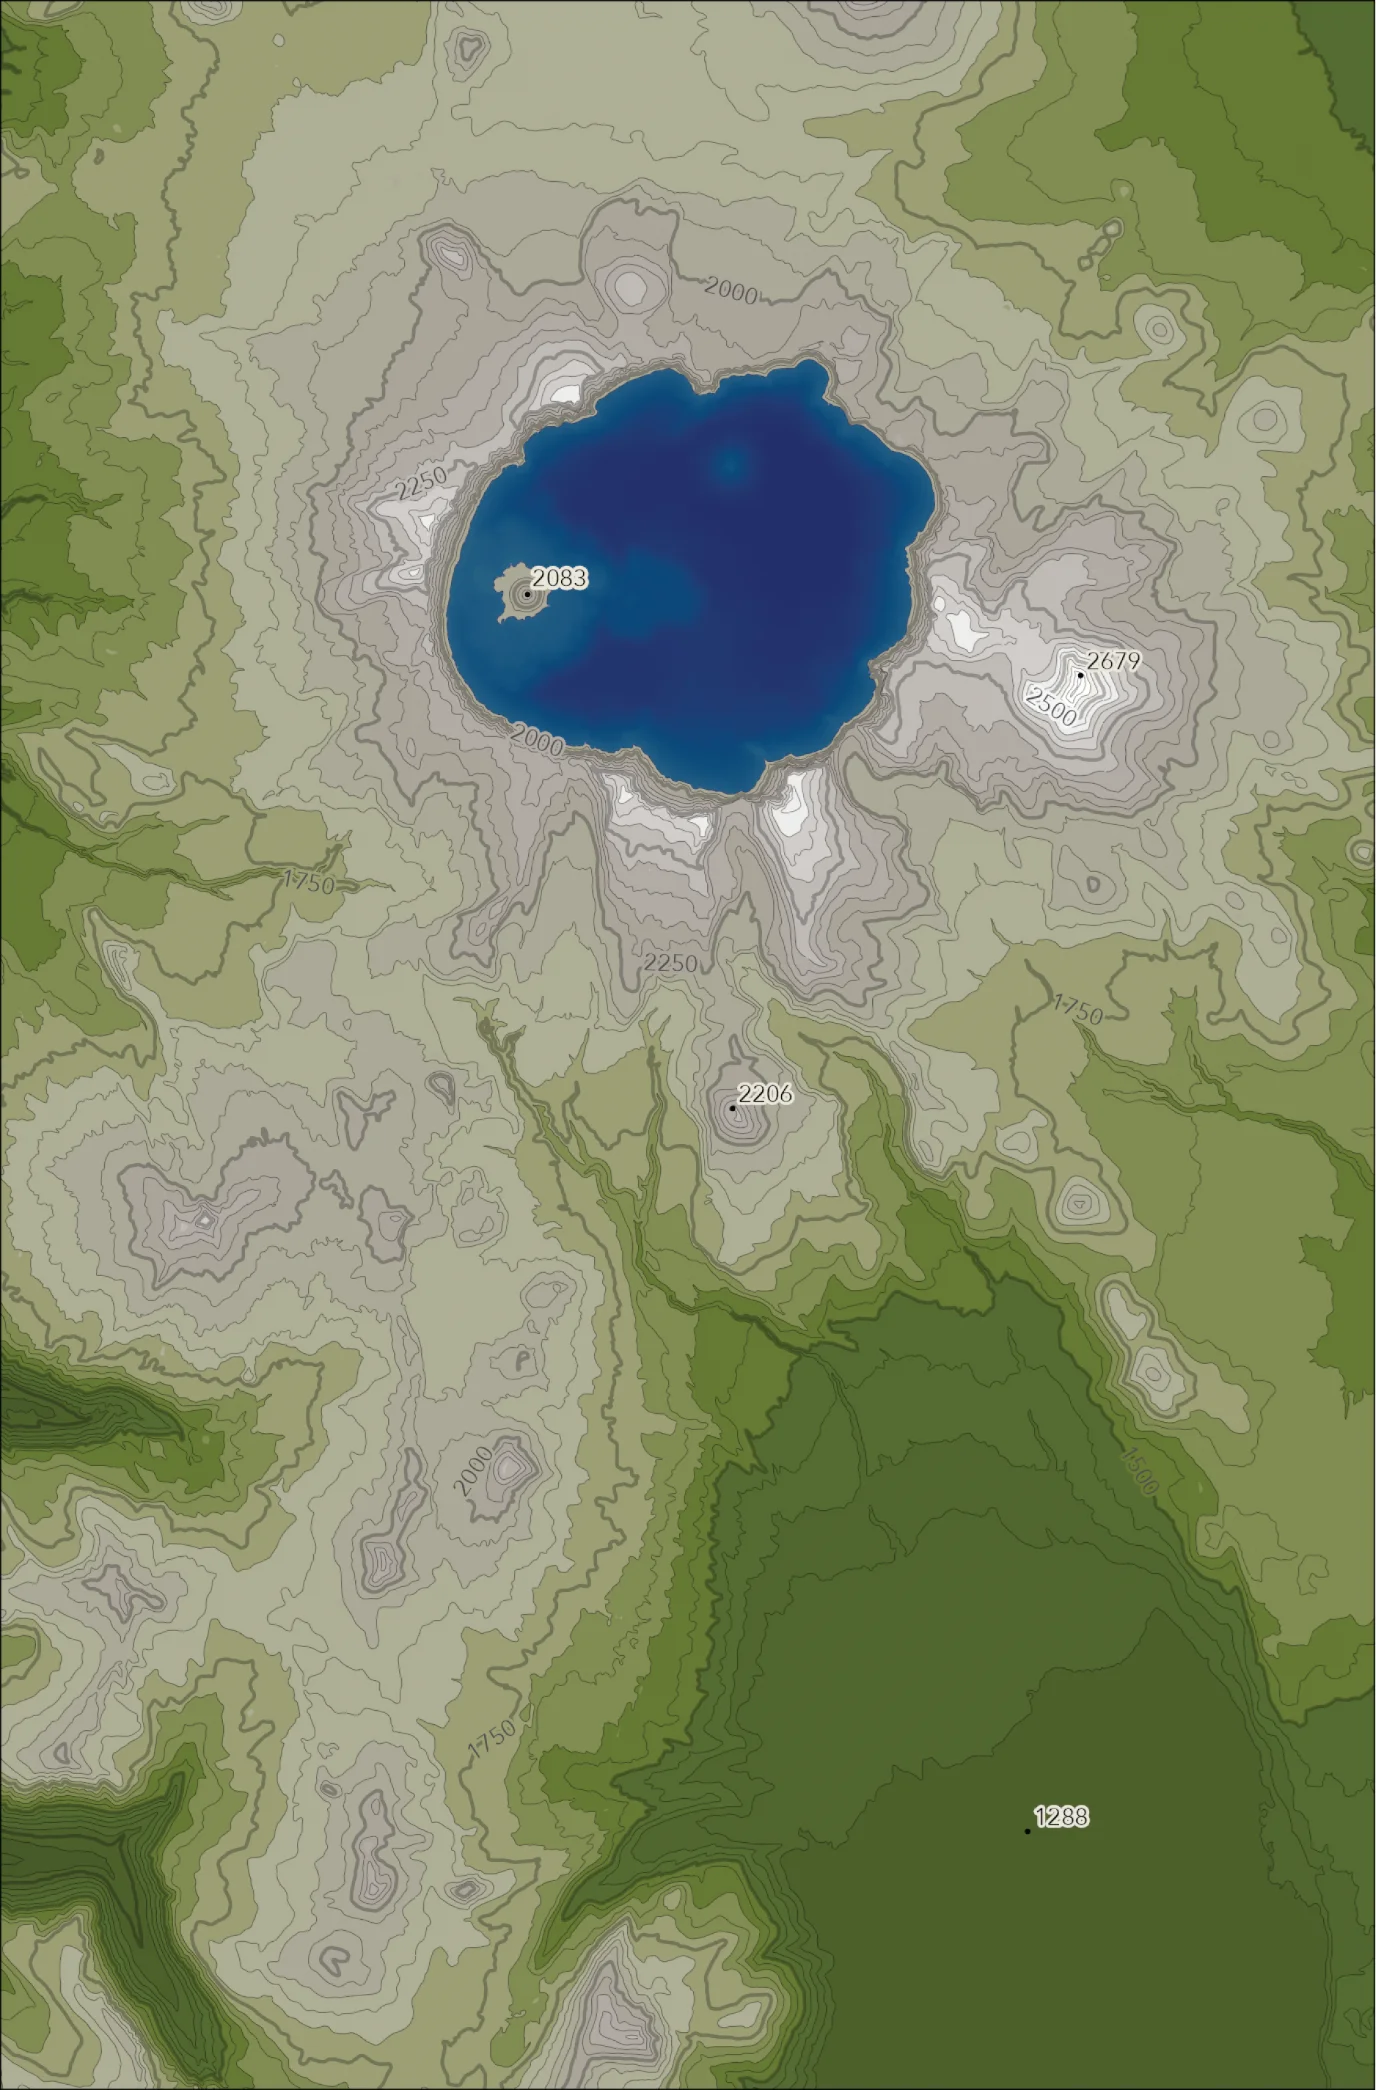
This relief depicts the topography and bathymetry of Crater Lake, Oregon—the deepest lake in the United States—which formed approximately 7,700 years ago when Mount Mazama erupted and the magma chamber subsequently collapsed (National Park Service, n.d.). This map was created in ArcGIS Pro using terrestrial and bathymetric digital elevation models (DEMs) obtained from the United States Geological Survey (USGS). Elevation band polygons were derived from the terrestrial DEM using the Contour Polygon tool at 250 m and 50 m intervals for index and intermediate contours, respectively, and coloured using hypsometric tinting to represent elevation bands. The bathymetric DEM was symbolized directly using hypsometric tinting. Spot heights were added to provide additional elevation reference.
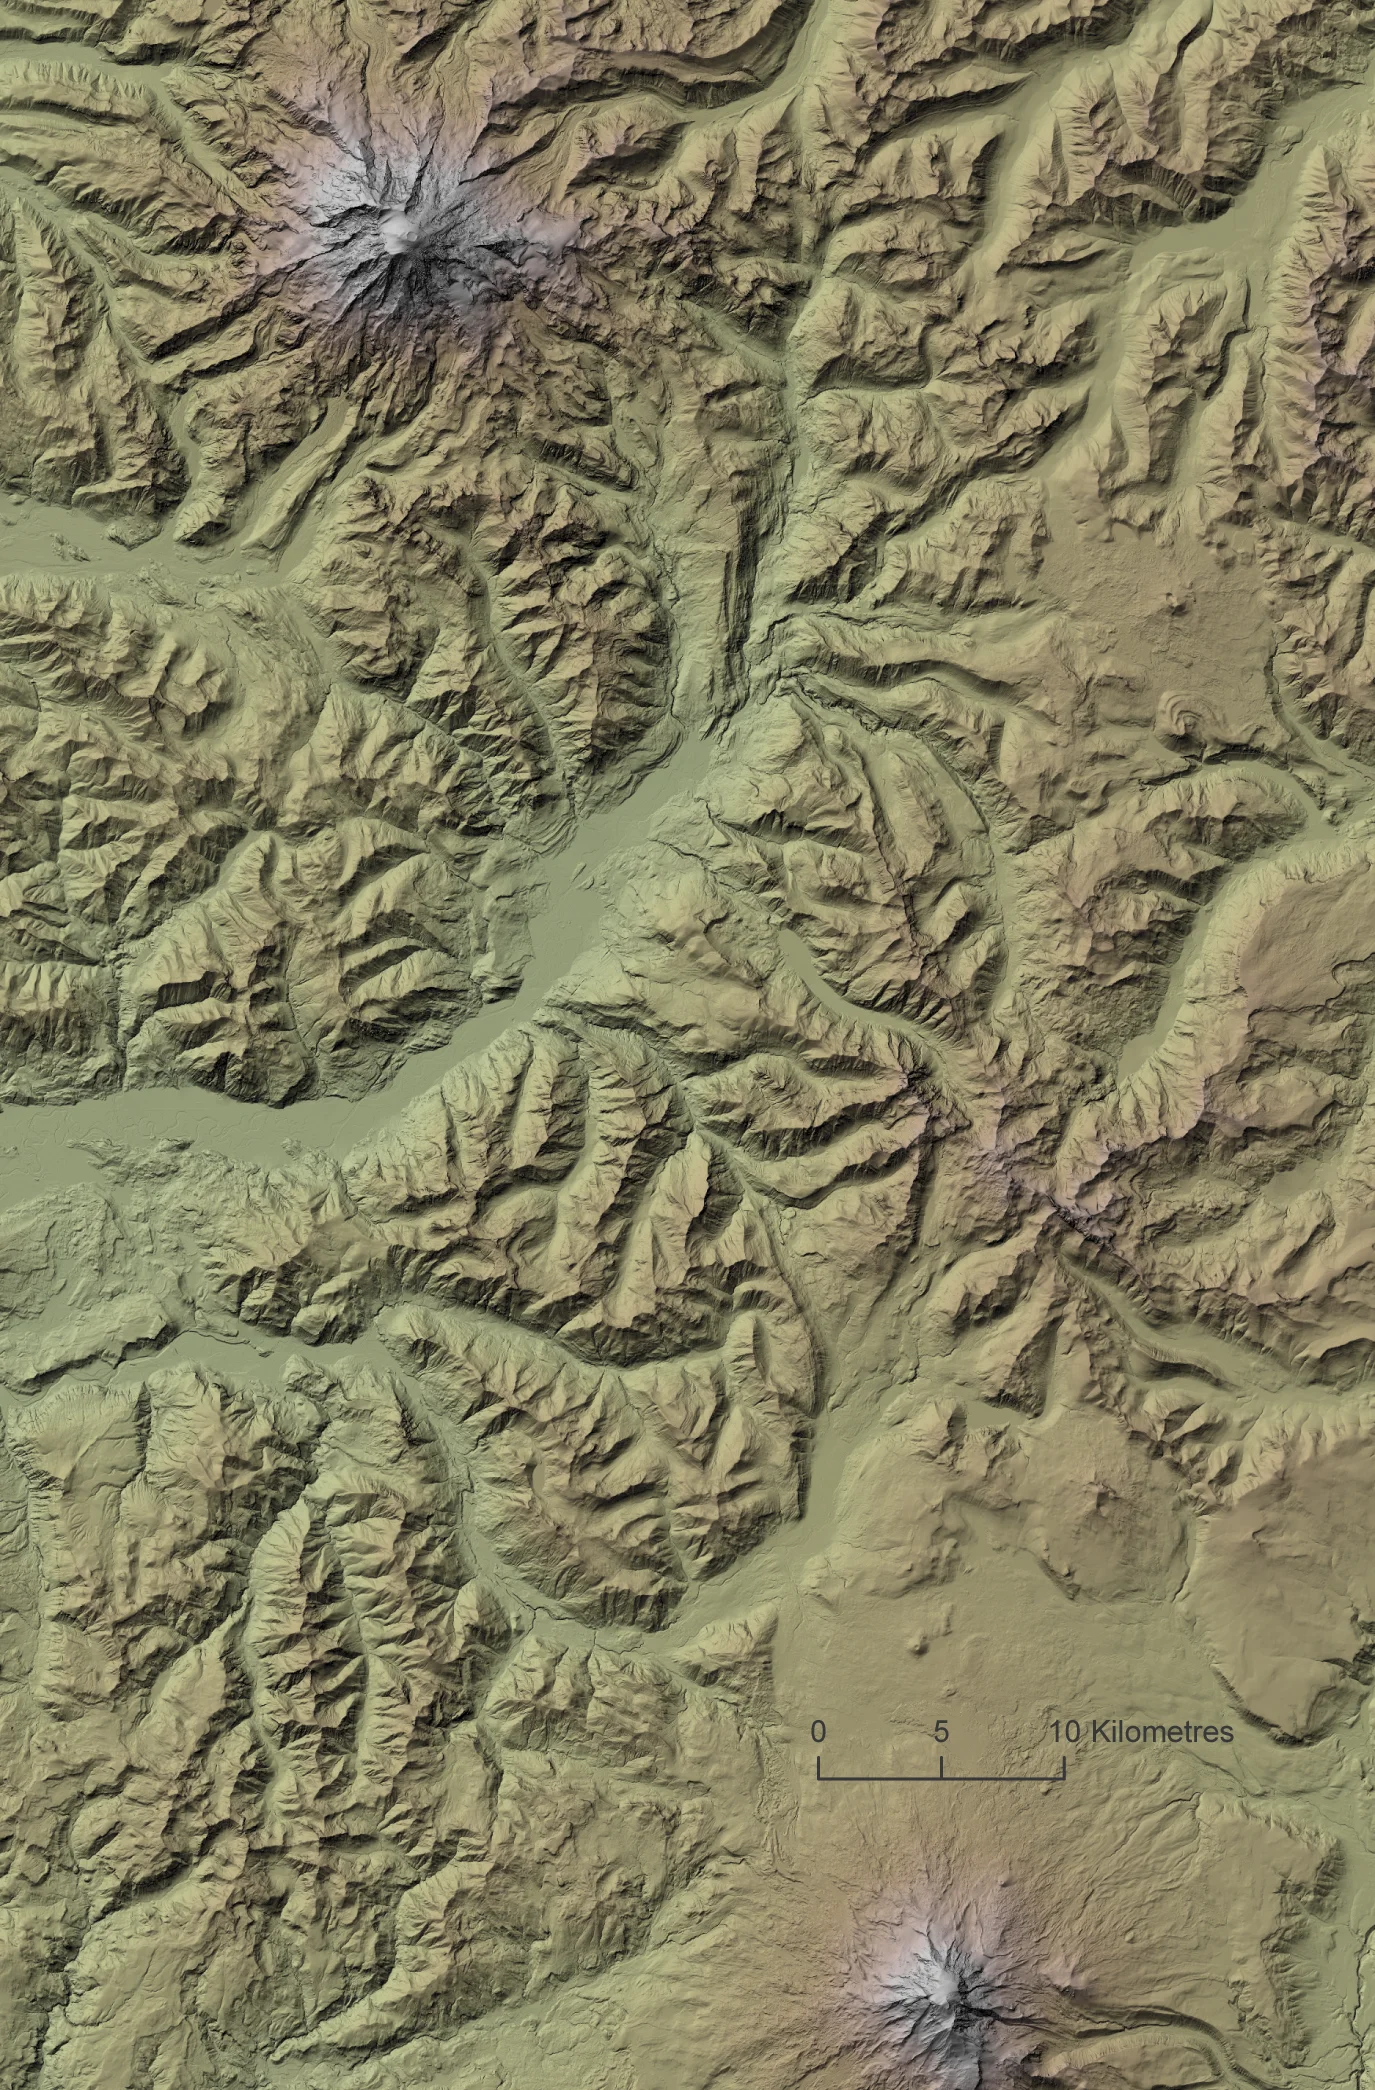
This relief depicts an enhanced hillshade of Mount Rainier, a 14,410-ft stratovolcano and the most glaciated peak in the contiguous United States, with 28 named glaciers (National Park Service, n.d.), and Mount Adams, a secondary volcano located to the southeast. This relief was created in ArcGIS Pro by generating several terrain representations from a digital elevation model (DEM), including three hillshades, a shaded relief image, and a hypsometric tint. The hillshades were produced using different altitude and vertical exaggeration values to represent terrain under multiple illumination conditions. When combined, these variations allowed both subtle and exaggerated landforms to be emphasized. Once exported as raster images, these layers were combined in Adobe Photoshop to create a composite relief image. By stacking the hillshades, shaded relief, and hypsometric tint layers, and using selection techniques to highlight ridgelines, it was possible to produce a more visually detailed and natural representation of the terrain.
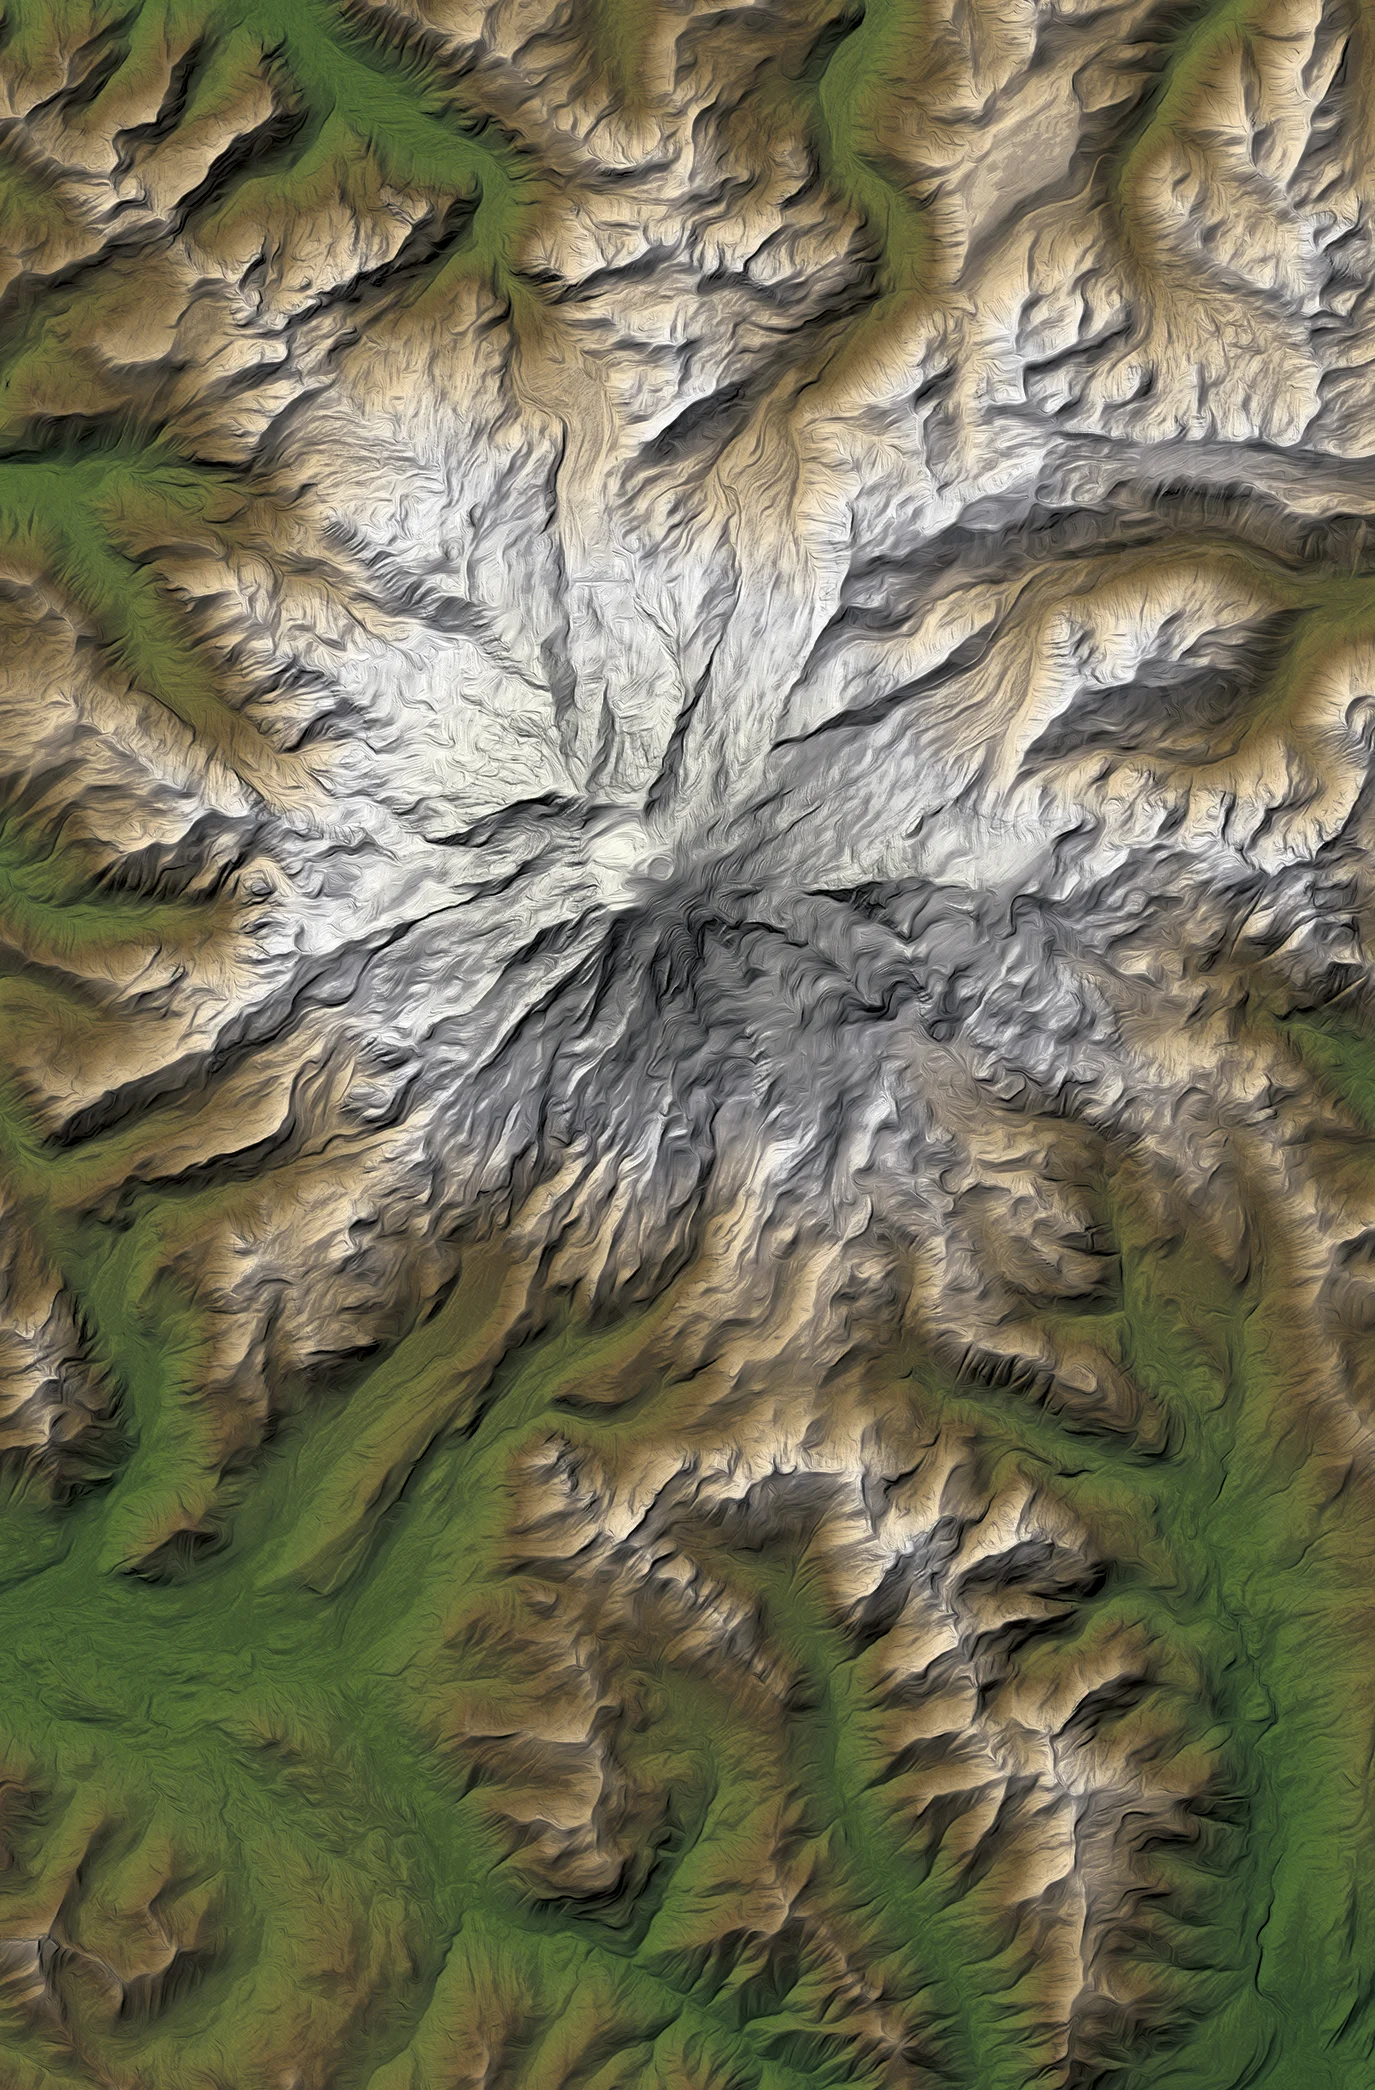
This relief builds upon the enhanced hillshade of Mount Rainier by following the same workflow in ArcGIS Pro and Adobe Photoshop, using the same DEM and composite hillshading techniques. The hillshades, shaded relief, and highlighting layers were combined into a single composite image before additional stylistic processing was applied. Once the hillshades, shaded relief, and various highlighting layers were combined into a single image, the image was stylized with the Oil Paint filter to transform its visual character. By adjusting the brush stylization, cleanliness, scale, bristle detail, and lighting options, I created the desired effect of a hand-painted oil painting by smoothing textures and replacing fine detail with brush-like strokes. The resulting brush strokes naturally follow and emphasize terrain features while maintaining terrain interpretability.
Technology Stack
- ArcGIS Pro
- Blender
- Adobe Photoshop
- Adobe Illustrator
Applied Skills
- Generated contours, hillshades, and hypsometric tints from DEM data in ArcGIS Pro.
- Applied colour ramps and controlled lighting techniques to enhance terrain depth.
- Imported DEM data into Blender to construct 3D terrain surfaces and custom hillshading workflows.
- Applied masking and point reclassification techniques to refine LiDAR-derived elevation surfaces.
- Combined contours, hypsometric tinting, and shaded relief to create layered terrain compositions.