Project Resources
About the Project
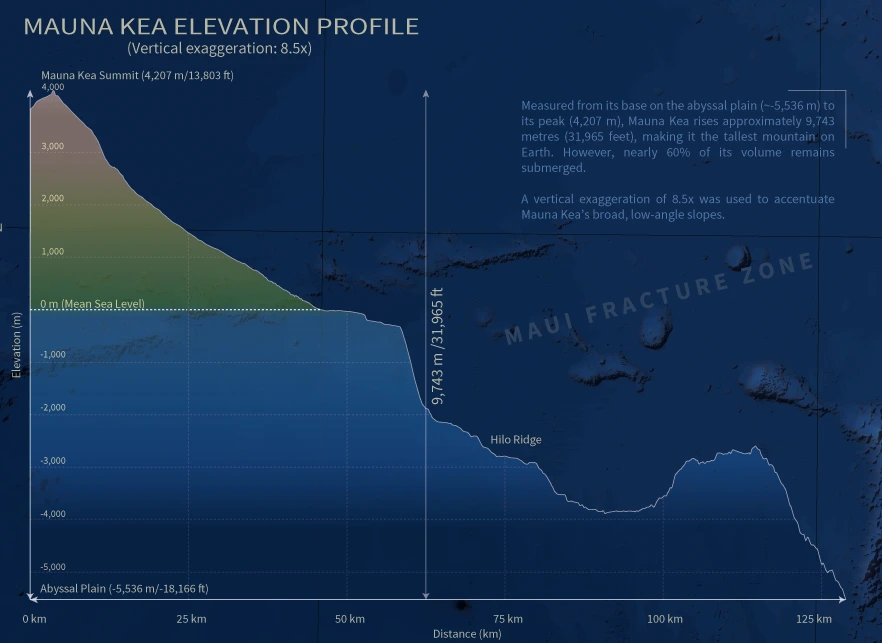
Measured from its base on the abyssal seafloor, Mauna Kea rises roughly 9,743 metres (31,965 feet), making it the tallest mountain on Earth. Hawaiʻi: Seafloor to Summit is a 48 × 36 inch topobathymetric map showing the full vertical extent of the eight main Hawaiian Islands, from the abyssal plain to the summit of Mauna Kea.
Conventional topographic maps measure elevation from sea level, which hides most of each Hawaiian volcano beneath the ocean. This map shows land and seafloor as one continuous surface.

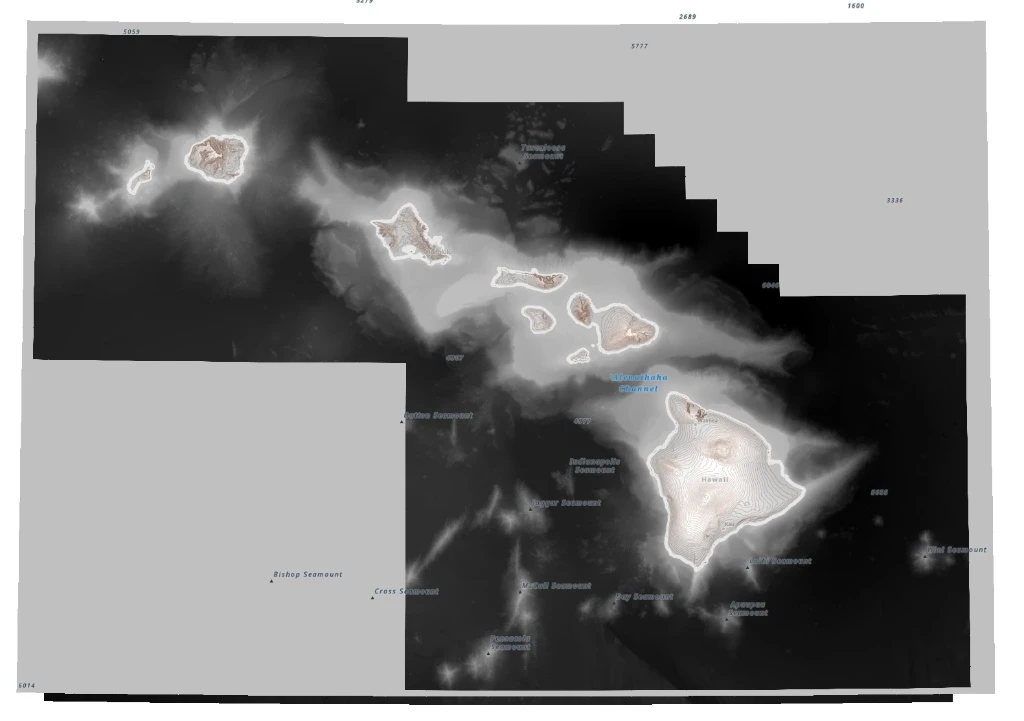
The topobathymetric surface is a mosaic of three DEM sources, layered in order of detail. The NOAA NCEI Coastal Relief Model (CRM, ~30 m) covers the islands and nearshore seafloor. Multibeam bathymetry from SOEST’s Hawaiʻi Mapping Research Group (~50 m) adds higher-resolution detail farther offshore where surveys exist. ETOPO2022 (~450 m) fills the remaining gaps.
Empty edge cells in the CRM, the grey areas in the following image, were not transparent but stored as 0 m, so they were set to NoData. All three sources were then projected to a common grid in Hawaii Albers Equal Area Conic (ESRI:102007), which preserves area and keeps distortion low across the main Hawaiian Islands, and merged with a blended mosaic, so each fades into the next rather than meeting at a hard seam. A 30 m grid was tested first, but 90 m kept the file manageable and hid faint alignment artifacts along the joins, with no loss of detail visible at the scale of the full island chain.
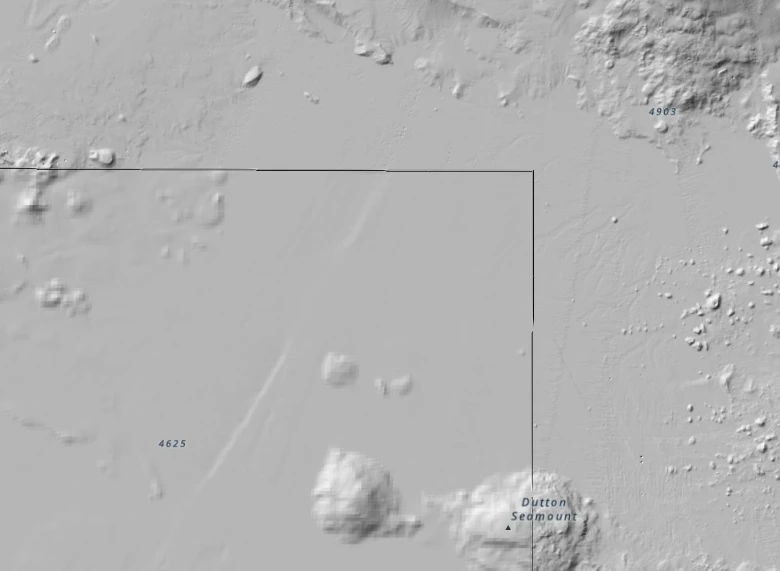
The merged DEM is symbolized with a custom diverging colour ramp that blends topography and bathymetry at sea level. Colour stops, positions, and transparencies were adjusted over many iterations. The DEM was classified using a defined interval of 100 m, producing 104 classes across the full elevation range. Terrain shading comes from a single hillshade (315° azimuth, 45° altitude) run on the merged DEM, so no shading lines form along the dataset boundaries. It sits over the colour ramp with a Multiply blend mode and uses a z-factor of 1.5 to bring out the broad, low-relief landforms on the seafloor.
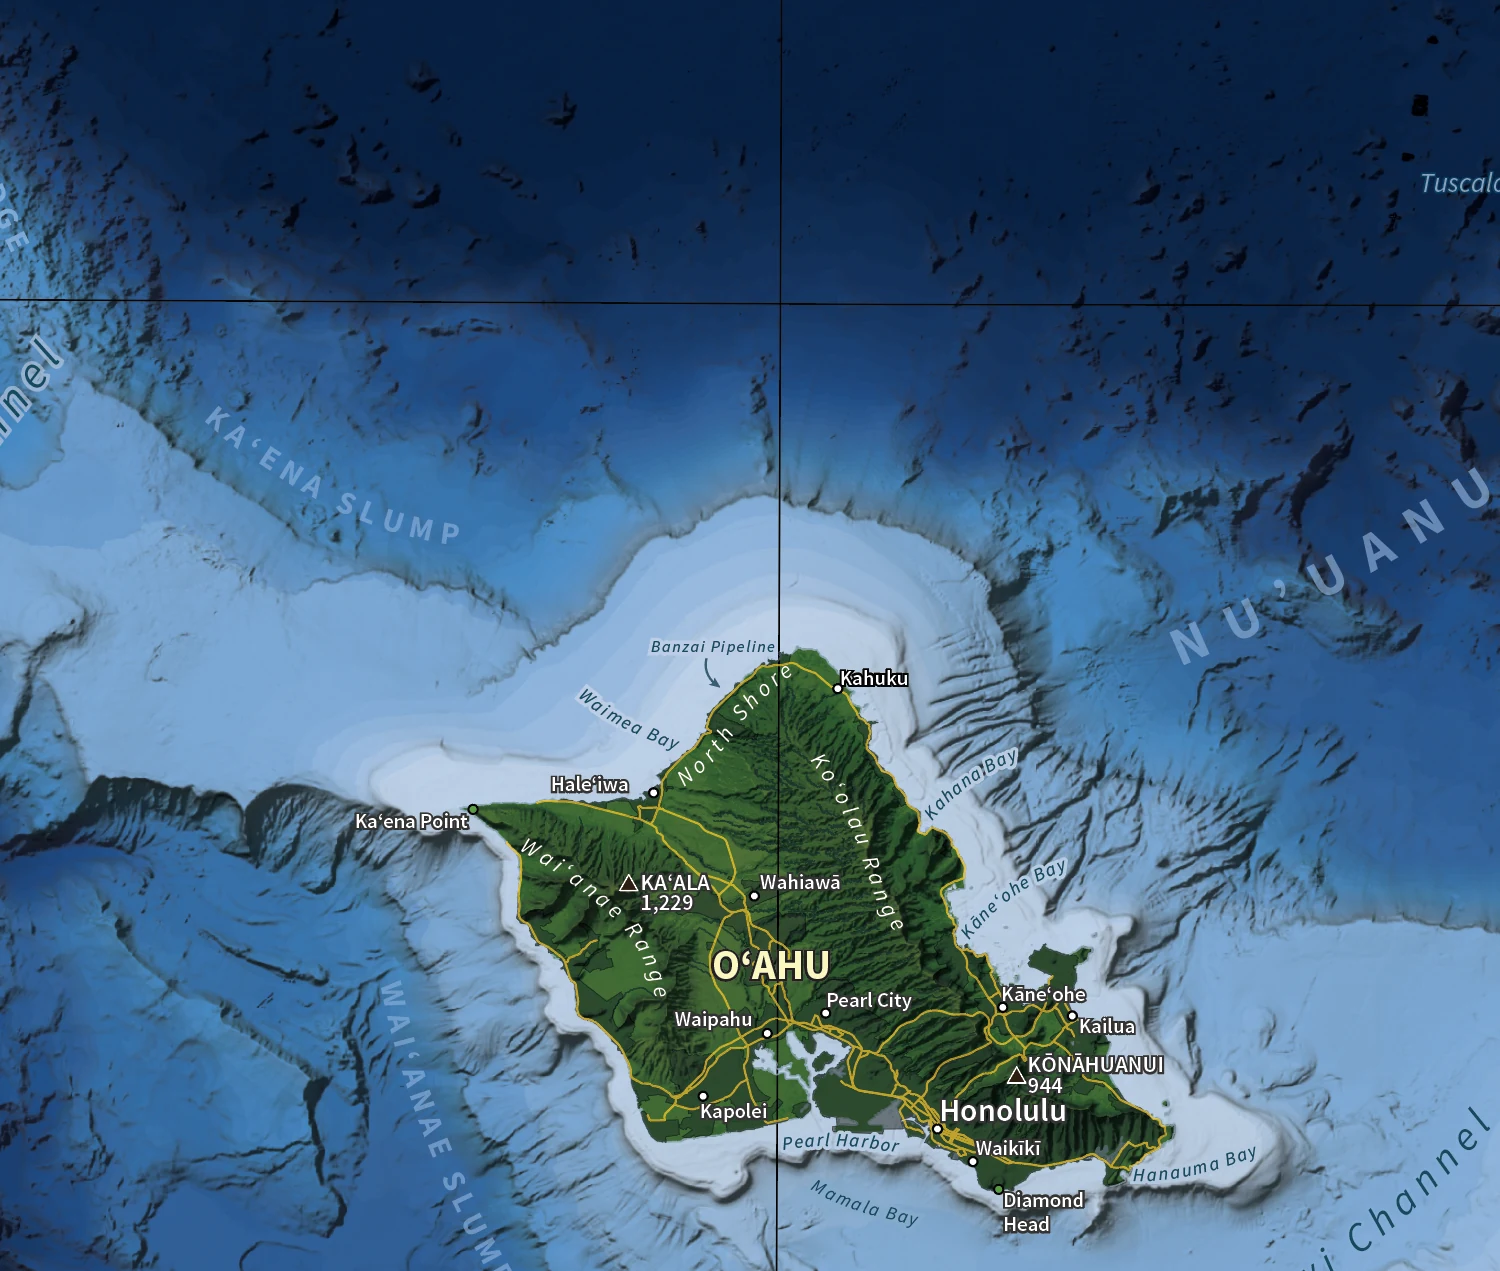
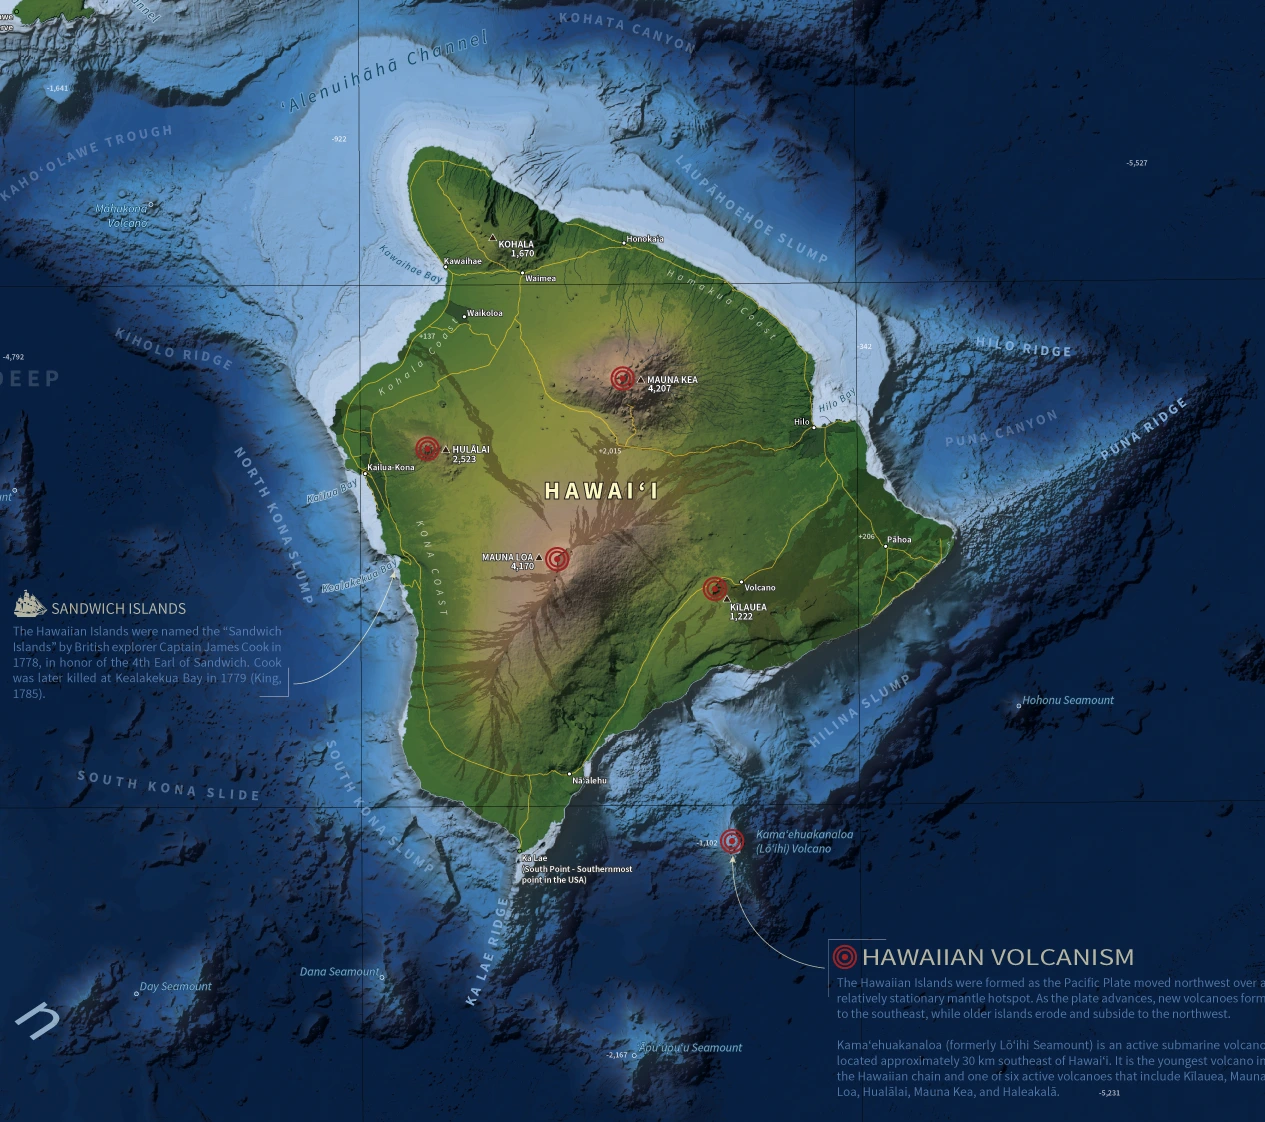
Bathymetric and terrestrial features were identified and labelled, including points of interest, population centres, summits, volcanoes, seamounts, and underwater landslides. All type is set in Source Sans Pro, and within that single family, typography doubles as a depth cue: land, channel, and bay labels are crisp and bright, while seafloor features are set in deliberately faint, letterspaced blue type that recedes into the water. The bright Pacific Ocean label is placed over the darker Hawaiian Arch label beneath it, so the two read as sitting at different depths. Together, these contrasts make the terrain feel more three-dimensional. Hawaiian place names use the ʻokina and kahakō.
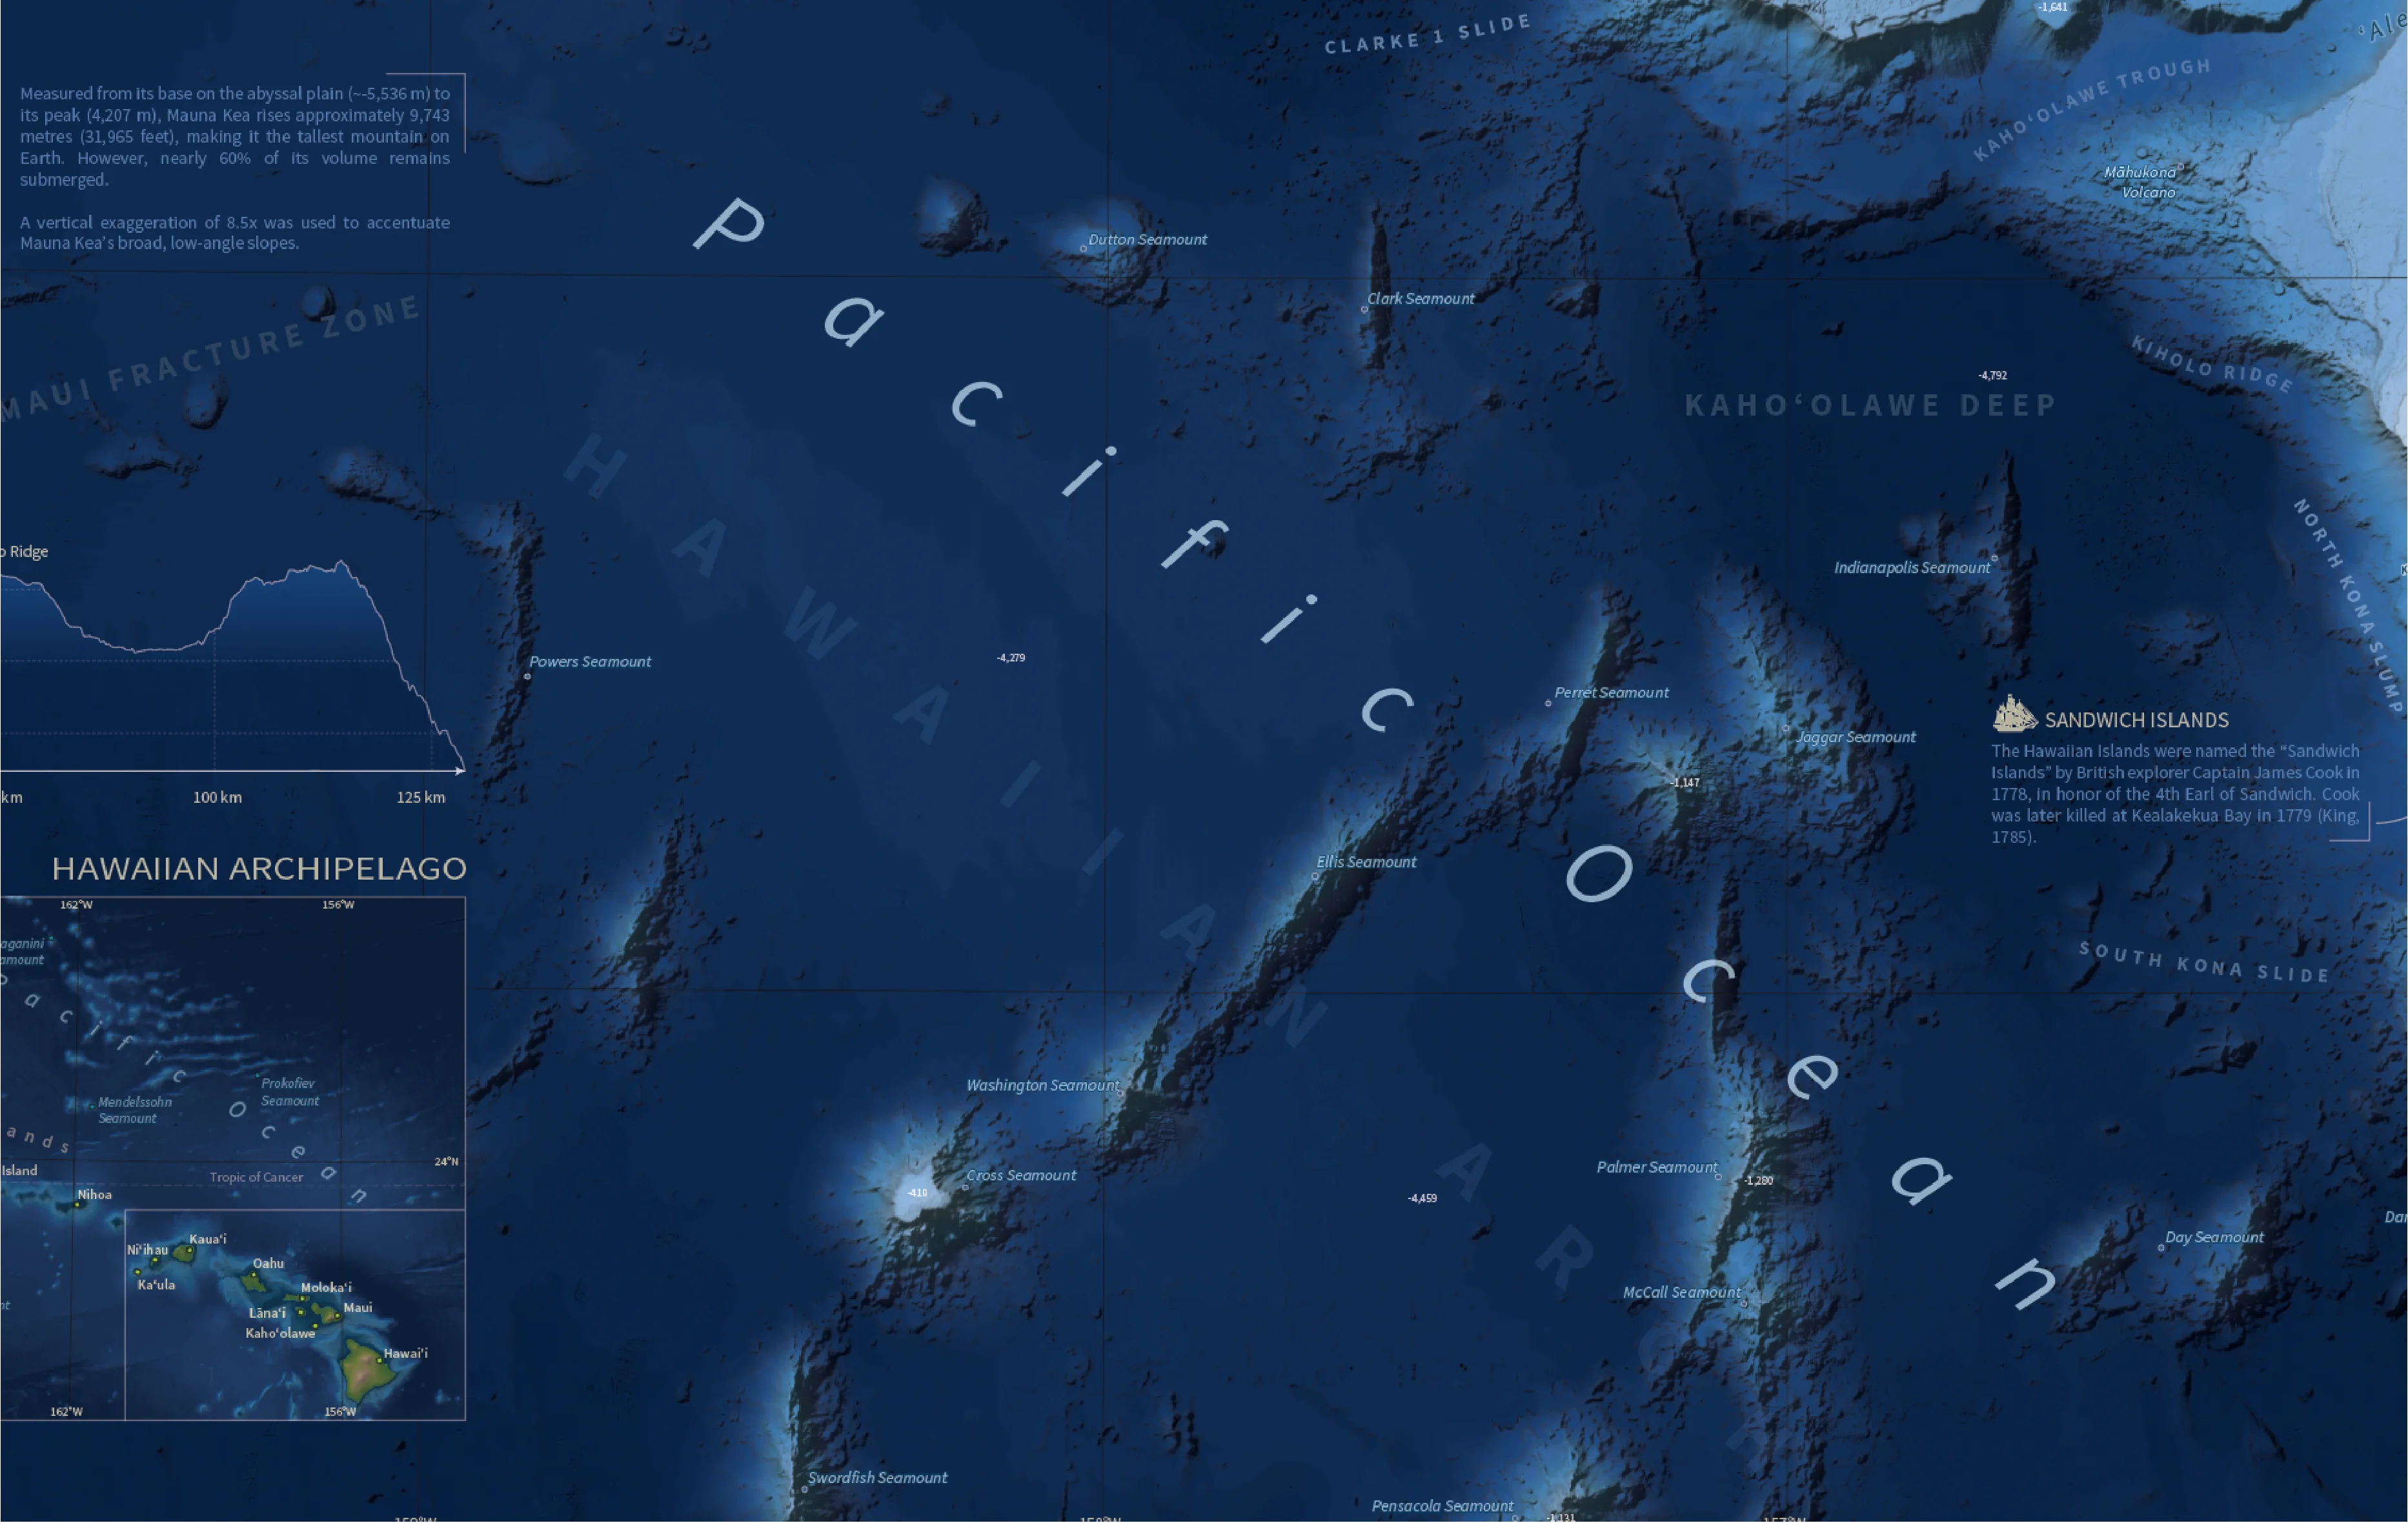
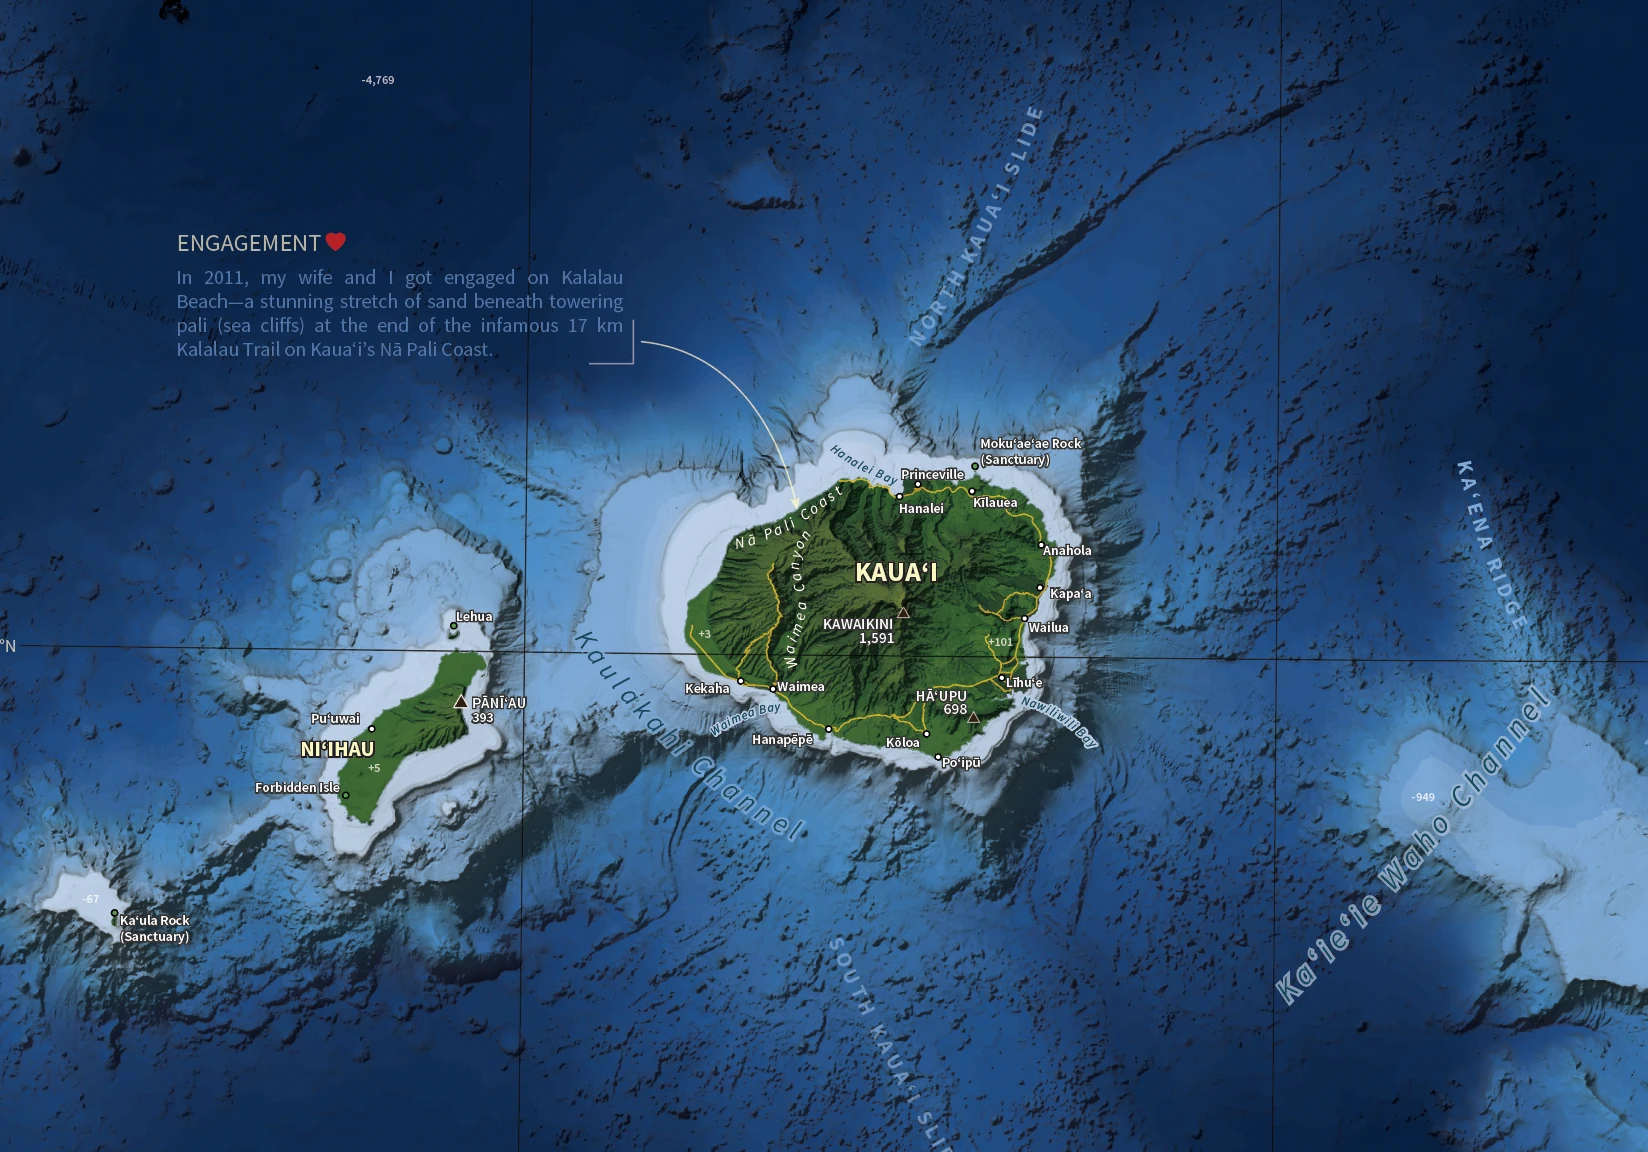
The map also includes several small contextual snippets, from the islands’ earlier name, the Sandwich Islands, to a personal note marking my engagement on the Nā Pali Coast, along with an inset map of the Hawaiian Archipelago for location context and a seafloor-to-summit elevation profile of Mauna Kea.
The elevation profile uses a vertical exaggeration of 8.5× to accentuate Mauna Kea’s broad, low-angle slopes. It was also partly a practical choice: 8.5× let the profile fit the page composition, matching the width of the inset archipelago map.
The final composition was completed in Adobe Illustrator, including finalizing text choices, cartographic fixes and refinements, and the addition of contextual information. The border is deliberately raised, with bevelled edges, to reinforce the map’s sense of elevation and depth.
Data Sources
Bathymetry
- Hawaiʻi Mapping Research Group (HMRG). (n.d.). Multibeam bathymetry data for Hawaiʻi. School of Ocean and Earth Science and Technology (SOEST), University of Hawaiʻi at Mānoa. https://www.soest.hawaii.edu/HMRG/multibeam/
- National Centers for Environmental Information (NCEI). (2022). Bathymetric datasets including Coastal Relief Model (CRM) and ETOPO 2022 global relief model. National Oceanic and Atmospheric Administration. https://www.ncei.noaa.gov/maps/bathymetry/
Vector & Thematic Layers
- Bureau of Transportation Statistics (BTS). (n.d.). North American roads dataset. https://geodata.bts.gov/
- NOAA Office for Coastal Management. (n.d.). Marine place names. data.gov. Archived March 21, 2021. https://web.archive.org/web/20210321204837/https://catalog.data.gov/dataset/marine-place-names
- Natural Earth. (n.d.). World geographic lines. https://www.naturalearthdata.com/downloads/
- State of Hawaiʻi. (n.d.). Hawaiʻi geospatial data layers (Island Coastlines, Ocean Mask, Streams, Marine Place Names, Reserves, Urban Areas, Geographic Names, and Geological Units). Hawaiʻi Statewide GIS Program. https://geoportal.hawaii.gov/
- U.S. Department of Agriculture (USDA). (n.d.). Tree canopy cover data. Forest Service Geospatial Data Gateway. https://data.fs.usda.gov/geodata/rastergateway/
Background Information
- Royal Collection Trust. (n.d.). A voyage to the Pacific Ocean…; v. 3 / by James King (1785). https://www.rct.uk/collection/1125188/a-voyage-to-the-pacific-ocean-v-3-by-james-king
- United States Geological Survey. (2003, October 24). Hawaii’s volcanoes revealed (Map I-2809). https://pubs.usgs.gov/imap/2809/
- United States Geological Survey. (2016, January 14). Volcano Watch—A geologic tour of the Hawaiian Islands: Oʻahu. https://www.usgs.gov/news/volcano-watch-geologic-tour-hawaiian-islands-oahu
- United States Geological Survey. (n.d.). Where is the largest active volcano in the world? https://www.usgs.gov/faqs/where-largest-active-volcano-world
Technology Stack
- ArcGIS Pro
- Adobe Illustrator
Applied Skills
- Applied raster processing techniques to resample and merge multiple DEM datasets into a continuous topobathymetric surface.
- Designed a custom diverging colour ramp that carries elevation across terrestrial and bathymetric environments.
- Applied cartographic design principles to build a clear, visually balanced layout supporting the seafloor-to-summit narrative.
- Used typographic hierarchy and contextual snippets to guide readers through complex elevation relationships.
- Extracted elevation data from DEMs and designed a vertically exaggerated elevation profile of Mauna Kea showing its full seafloor-to-summit extent.